Shock tube simulation project
SHOCK TUBE
AIM:
To simulate a shock tube problem and understand the behaviour of the molecules by obtaining pressure and temperature graphs.
INTRODUCTION:
A shocktube is a setup in which a rectangular or a circular cross section pipe consists of two regions , high pressure and low pressure region. In this simulation, a transient shock tube simulation is setup , with Adaptive mesh refinement in species, so that when the N2 mole fraction changes, the mesh is refined.
CASE SETUP:
A transient simulation is carried out for a time period of 0.003 seconds.
The rectangular tube is divided into two sections, high pressure (600000 Pa) and low pressure (101325 Pa). The simulation is done by placing an event. This event option under Regions and initialization, acts as a diaphragm, where after 0.001 seconds, the interaction between high pressure and low pressure is allowed. This is where the shocks are generated.
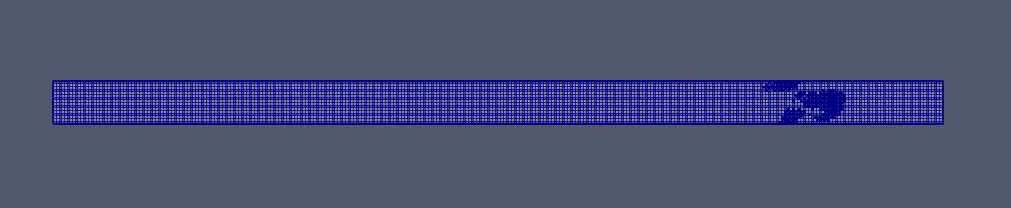
Base grid size: dx = dy = dz = 0.0006
Adaptive mesh refinement embed level = 3
MESH VISUALISATION IN PARAVIEW:
PRESSURE PLOT (HIGH PRESSURE REGION 0:
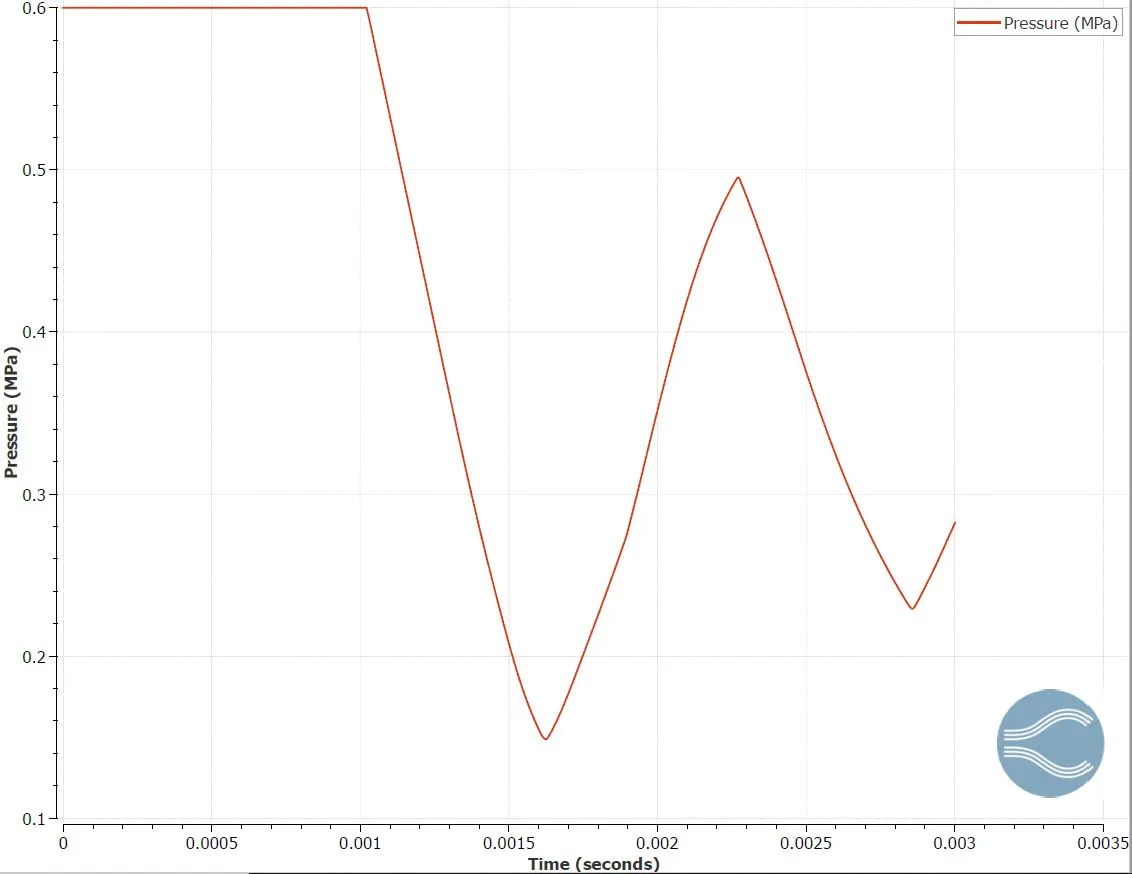
The pressure plot in the high pressure region shows , how the pressure changes after 0.001 seconds(time after which the interaction is allowed to take place). The cyclic pattern shows the interaction with the low pressure region , which is causing the pressure value to fluctuate with respect to time and gradually converging with respect to time, till it reaches a steady pressure value.
PRESSURE PLOT (LOW PRESSURE REGION 1):
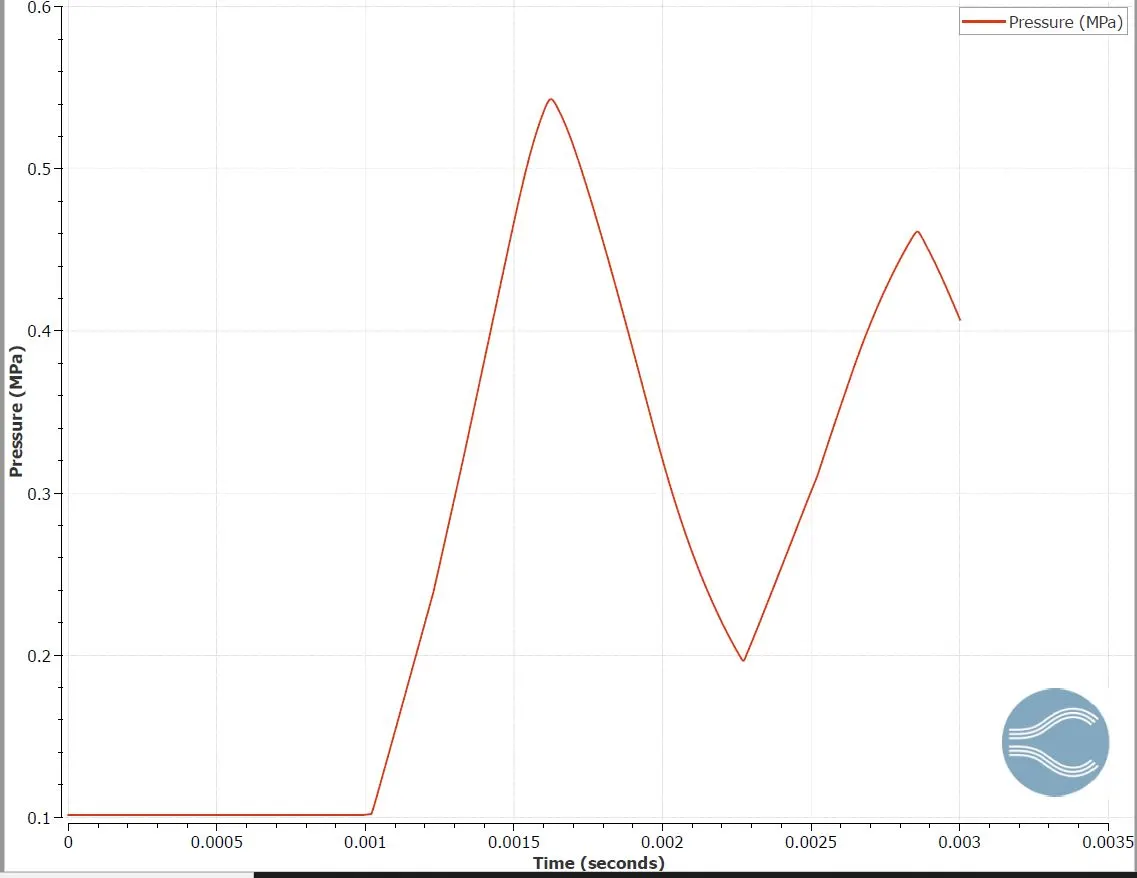
The pressure plot in the low pressure region follows the same pattern, but with different values of pressure, since here, the interaction takes place with the region of high pressure from low pressure.
TEMPERATURE PLOT (HIGH PRESSURE REGION 0):
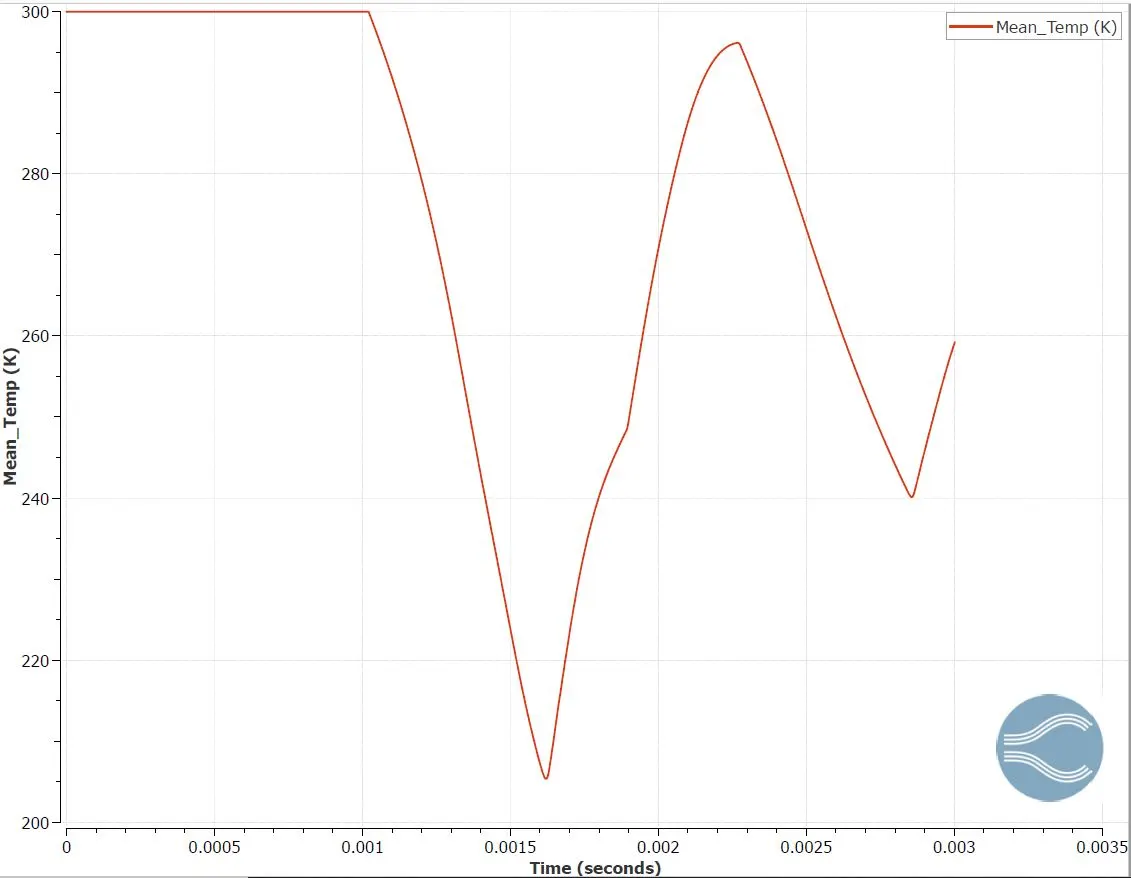
The temperature plot in the high pressure regions shows some variation after interaction with the molecules in the low pressure region. The low pressure region has a rise in temperature after the interaction with the high pressure gases. This is similar to auto ignition problems in gasoline engines, where the high pressure hydrocarbon molecules are sprayed in the chamber which has a low pressure region.
TEMPERATURE PLOT (LOW PRESSURE REGION 1):
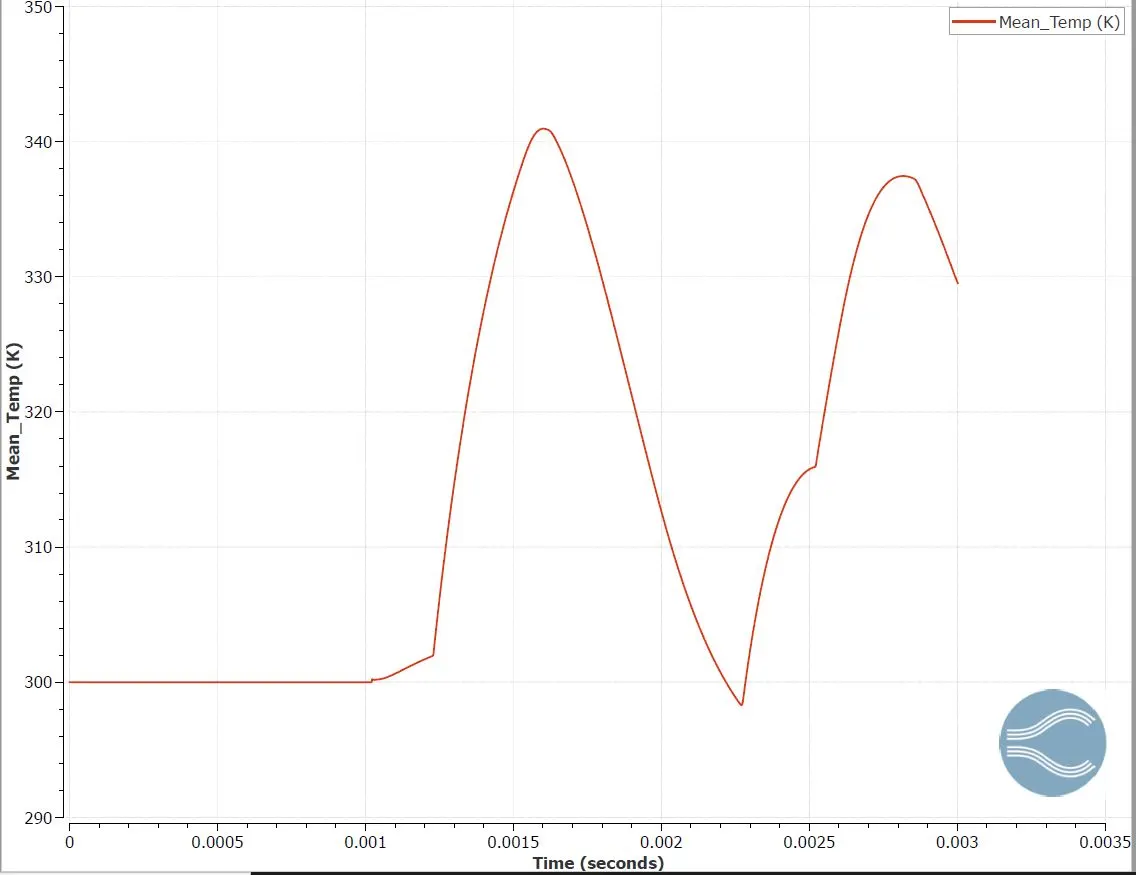
The temperature in the low pressure region experiences a rise in temperature after the interaction with the high pressure gases, and these continue to form a converging cyclic pattern, until these reach a steady state over time.
CELL COUNT:
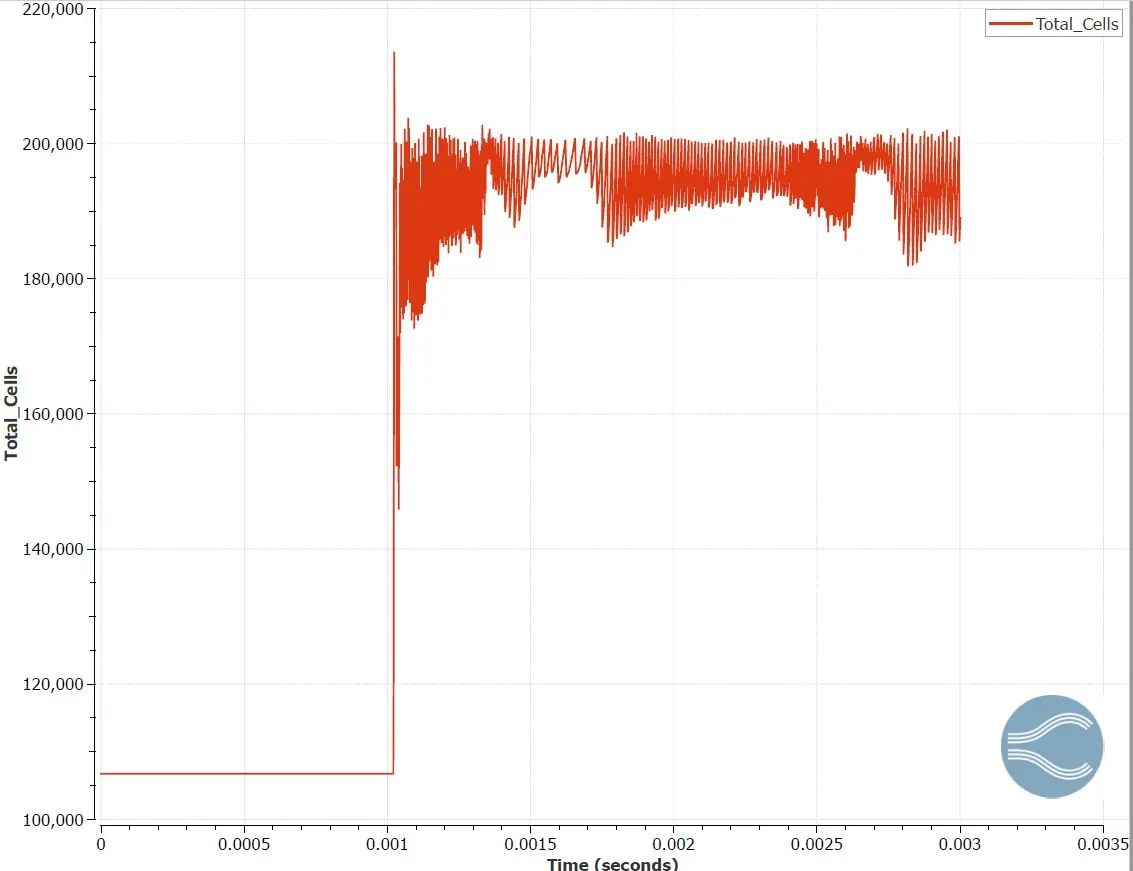
The cell count plot shows how the cell count changes after 0.001 seconds. Since the embedding level for N2 fraction is given as 3, every time when it changes, the cell count is refined to capture the changes, which is shown in the plot.
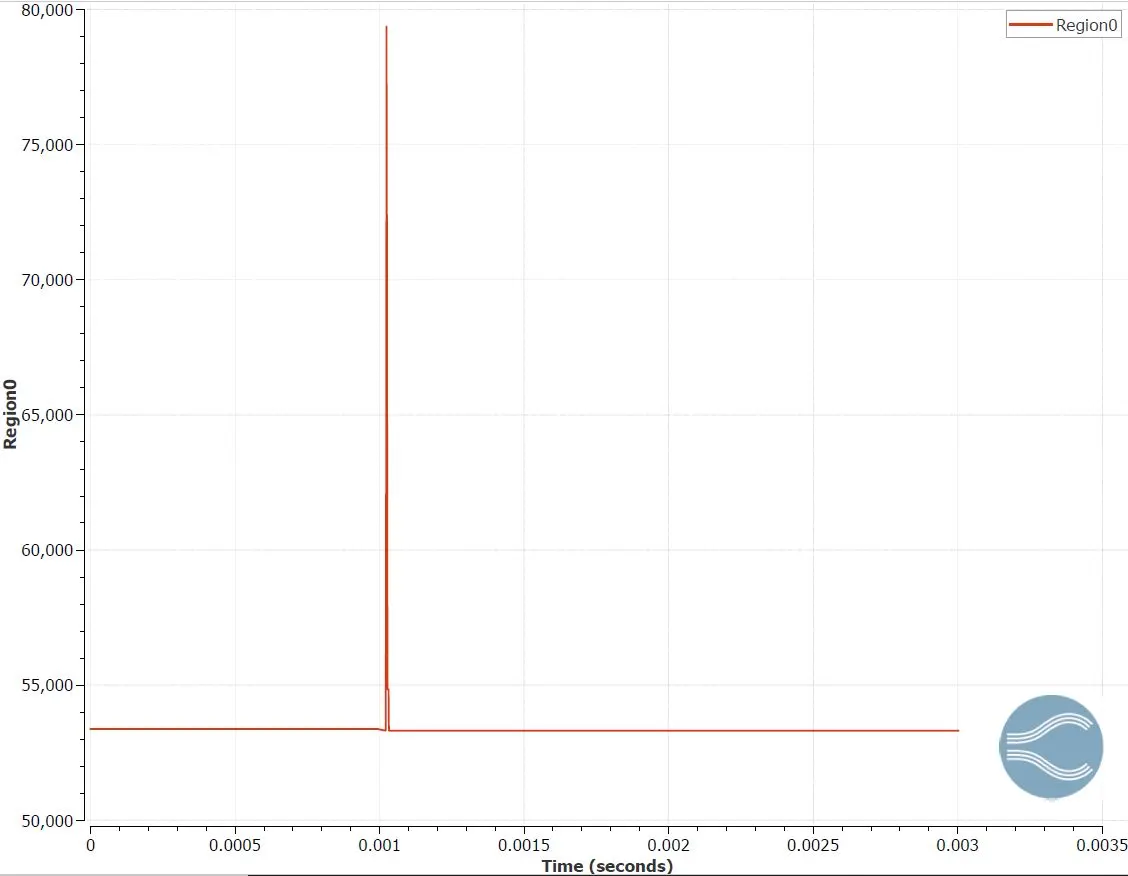
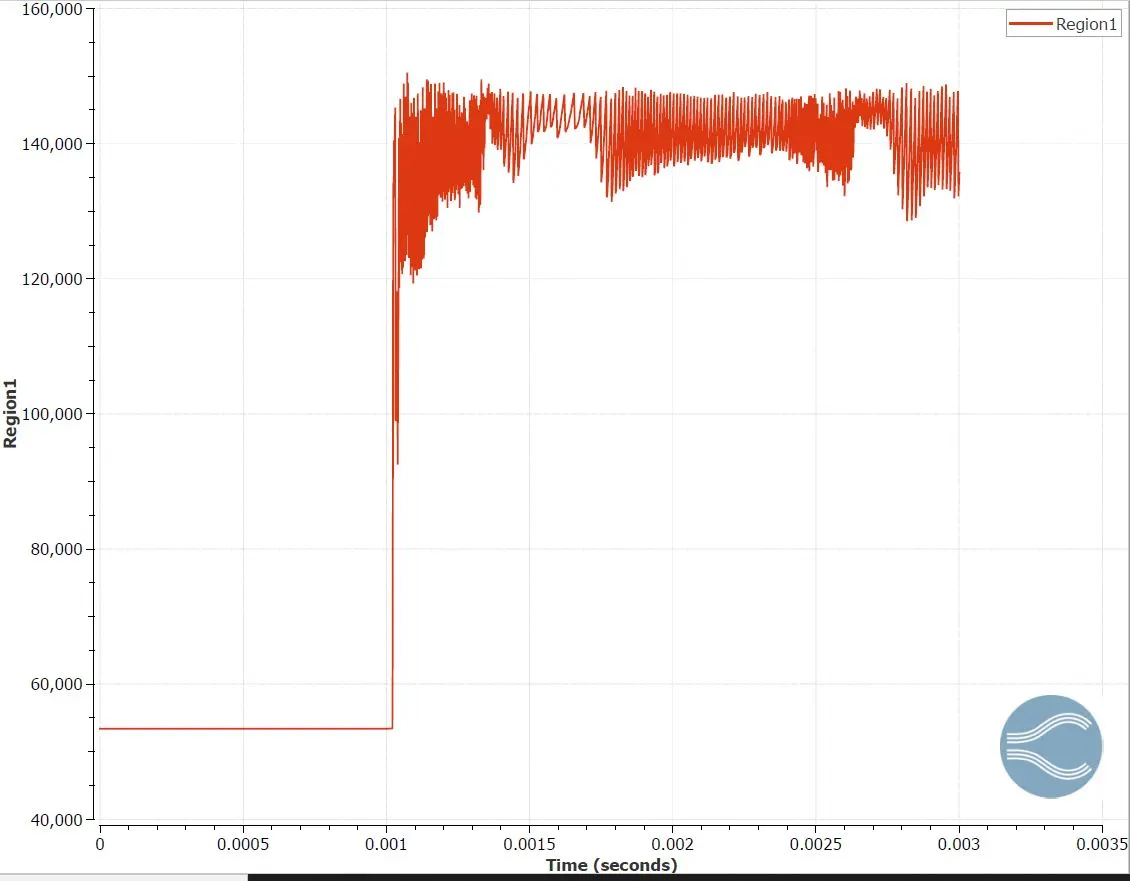
The cell count in high pressure region increases suddenly and then tends to get back to its original value, since the molecules move from high pressure to low pressure and the adaptive mesh refinment embedding takes place mostlyin the high pressure region, since high pressure region molecule is N2, and the low pressure region molecule is O2 and the mesh refinment is assigned for N2 Species. The difference in cell counts can be seen in the low pressure region.
HIGH PRESSURE REGION CELL COUNT:
LOW PRESSURE REGION CELL COUNT:
CONCLUSION:
The shock tube simulation helped understood the effect of interaction between a high pressure and low pressure region and the temperature effects on the shock waves occurring during the interaction. The same concept could be applied to understand the effect of auto ignition occurring in an IC engine.
ANIMATION LINK: https://drive.google.com/file/d/1O5HYX6bEPEV3Mhrgk_qT1IjnbqAXstlL/view?usp=sharing