Flow over a backward facing step
FLOW OVER A BACKWARD FACING STEP
AIM:
To simulate a flow over a backward facing step using CONVERGE CFD and visualise the area in the wake field.
INTRODUCTION:
Backward facing step is the most common type of simulaton done, to understand the cfd concepts and working of solvers. It is the simple problem which can be simulated to visualise flow along the rectangular channel as well as understand the formation of wake regions during the flow.
CASE SETUP:
The study is done with certain boundary conditions which are fixed for different mesh sizes.
Boundary conditions:
Inlet pressure: 110325 Pa
Outlet pressure: 101325 Pa
This initiates the flow to move within the step area.
2d conditions is given for sidewall and for the top and bottom walls , symmetry condition is given.
MESH SIZES:
Three different mesh size are being used:
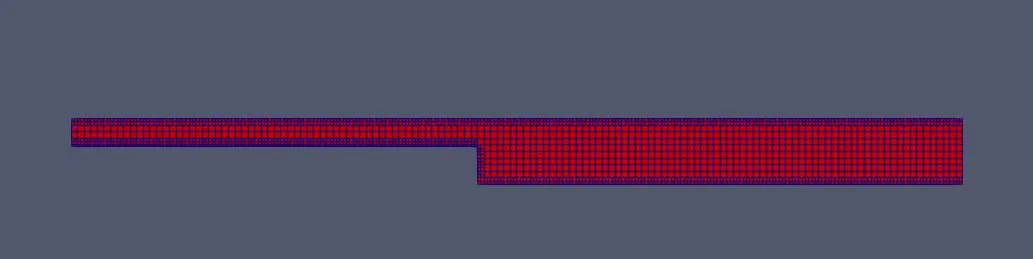
1) dx = dy = dz = 2e-3 m.
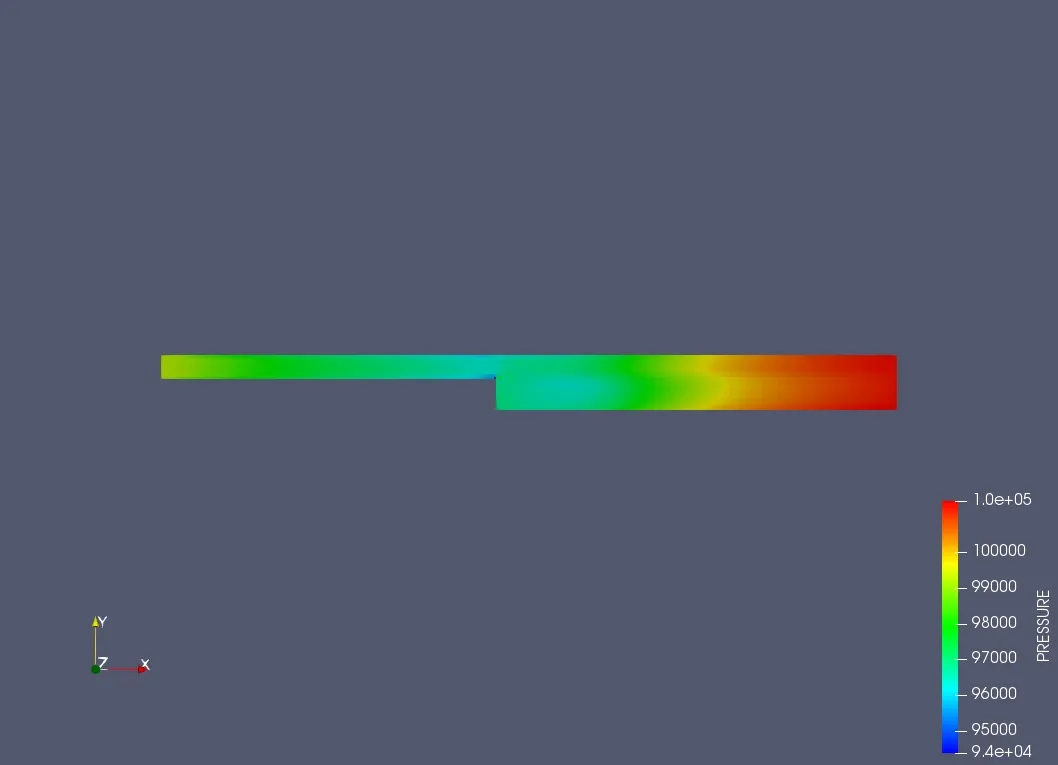
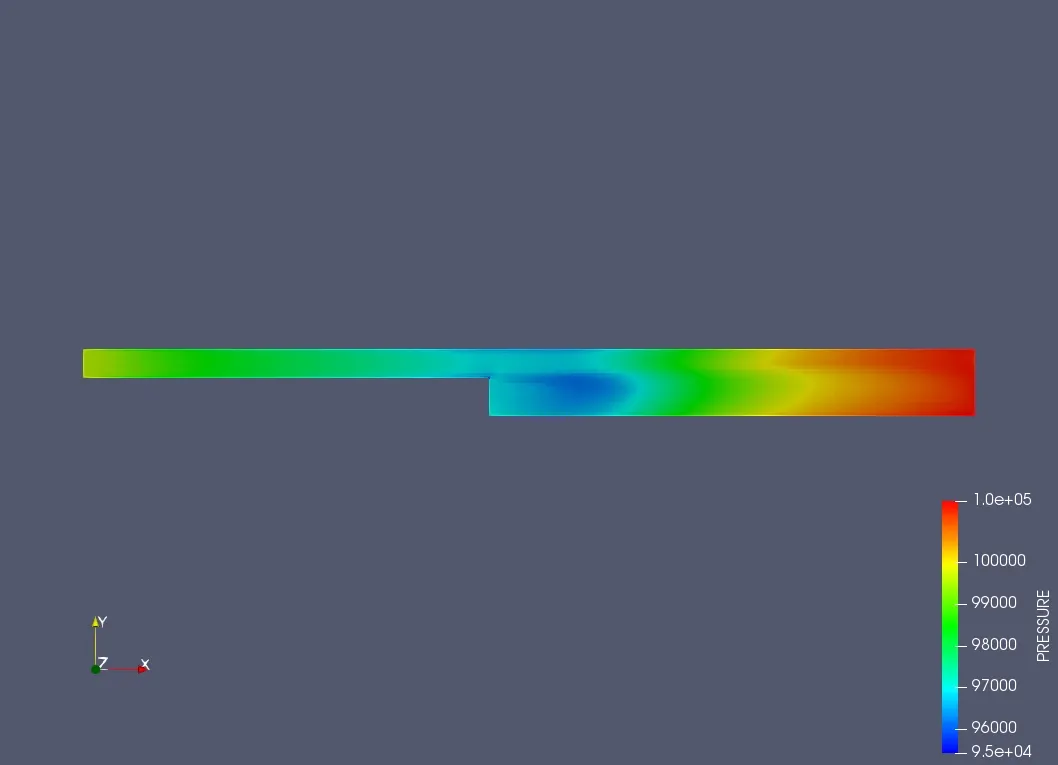
PRESSURE CONTOUR:
VELOCITY CONTOUR :
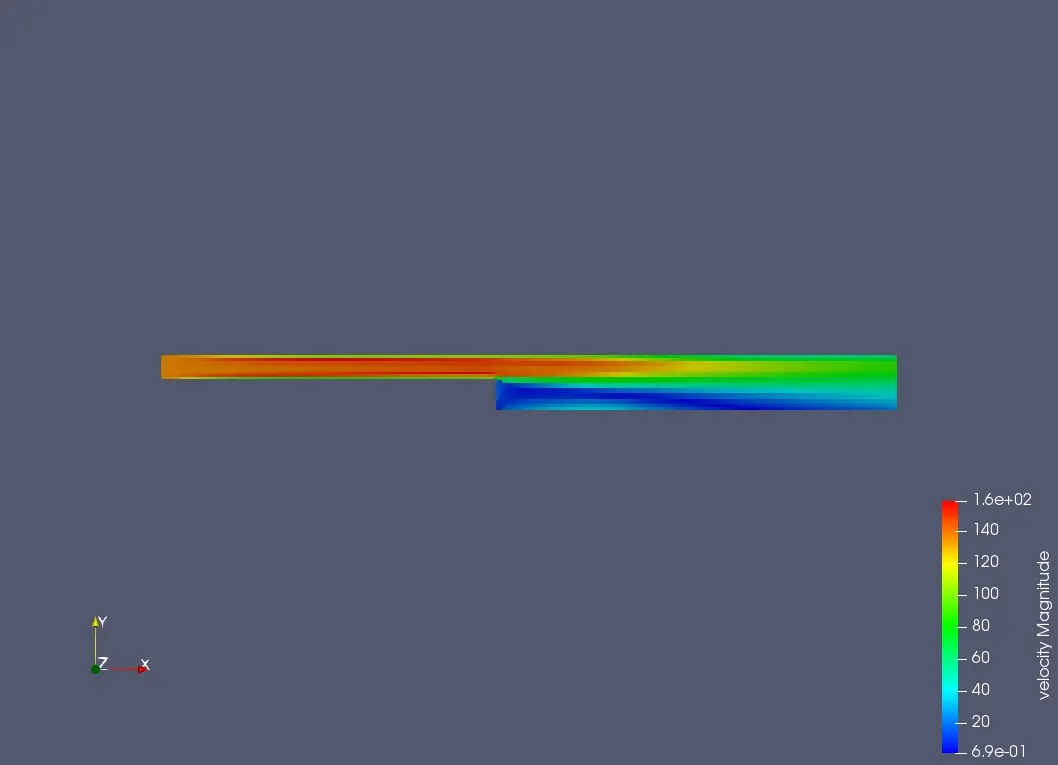
The area where the wake is formed is clearly displayed in the velocity contour in blue colour, where the velocity is low .
PLOTS:
PRESSURE PLOT (INLET):
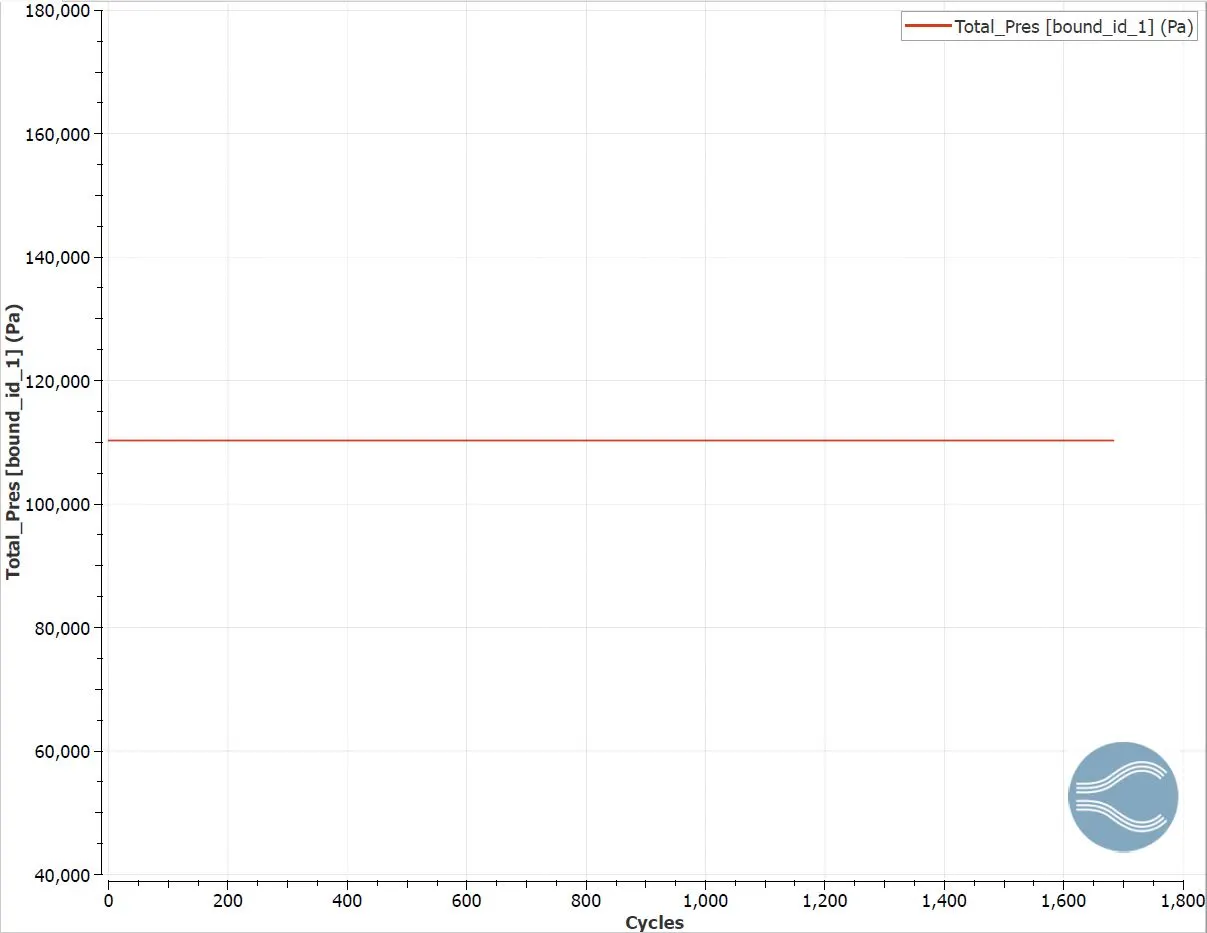
The boundary condition given in inlet is the total pressure displayed is 110325 Pa.
PRESSURE PLOT (OUTLET):
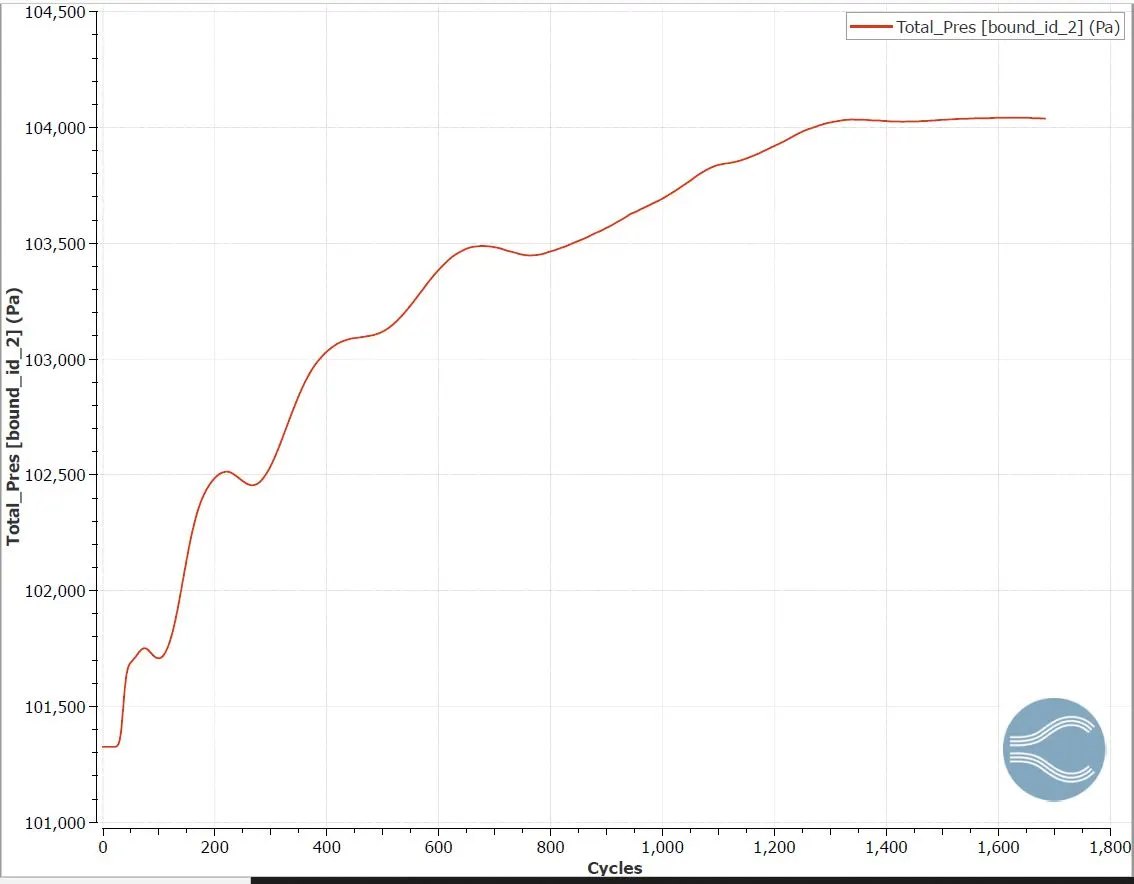
The total pressure in the outlet is displayed which is the summation of static pressure + dynamic pressure.
VELOCITY PLOT (INLET):
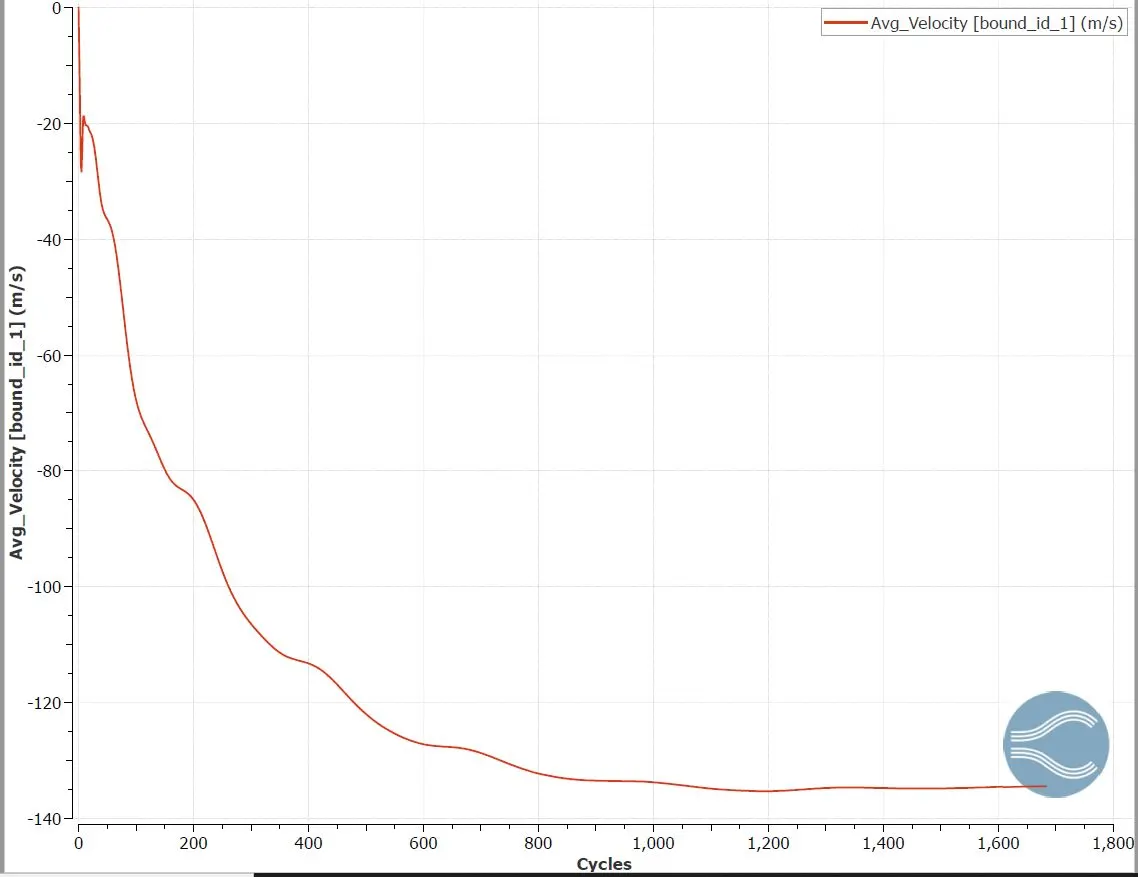
The average velocity at the inlet is recorded which is converged to approximately around 135 m/s.
VELOCITY PLOT (OUTLET):
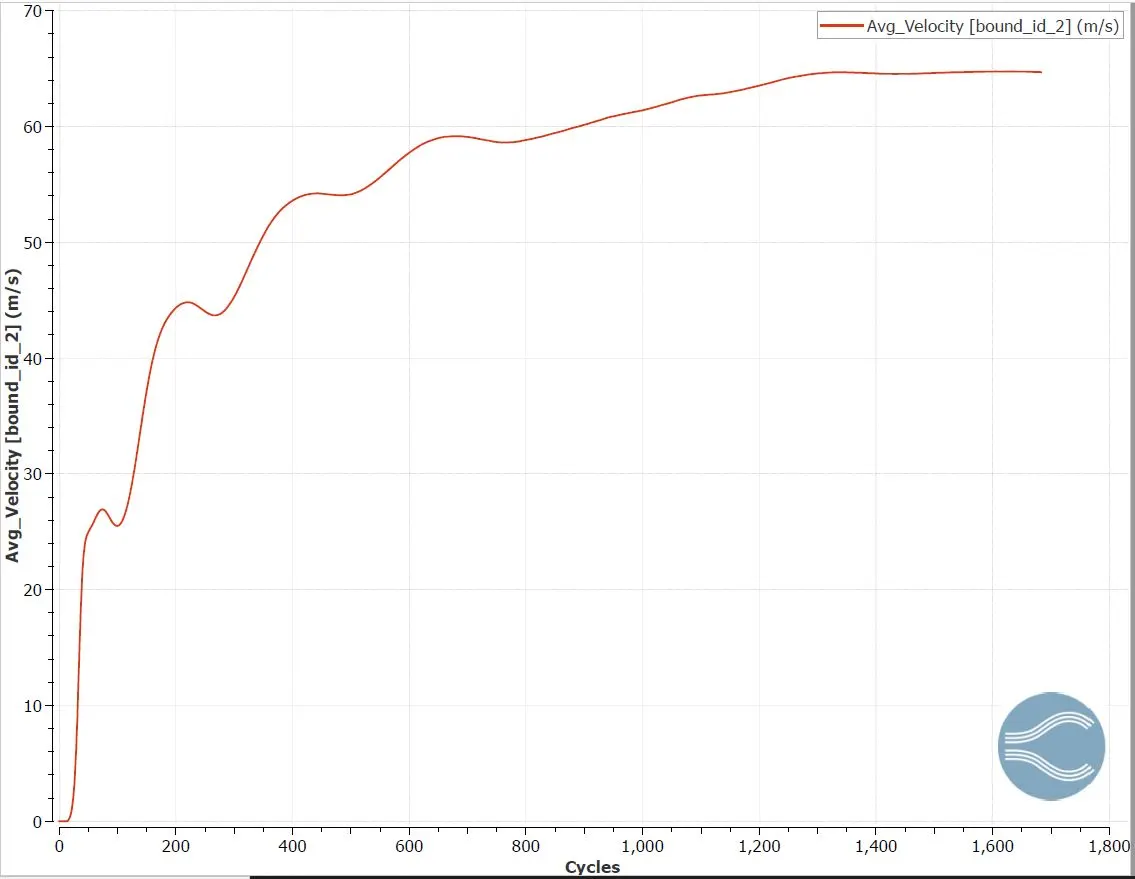
The average velocity measured at the outlet is recorded. This velocity is created due to the pressure difference of 9000 Pa.
MASS FLOW RATE (INLET):
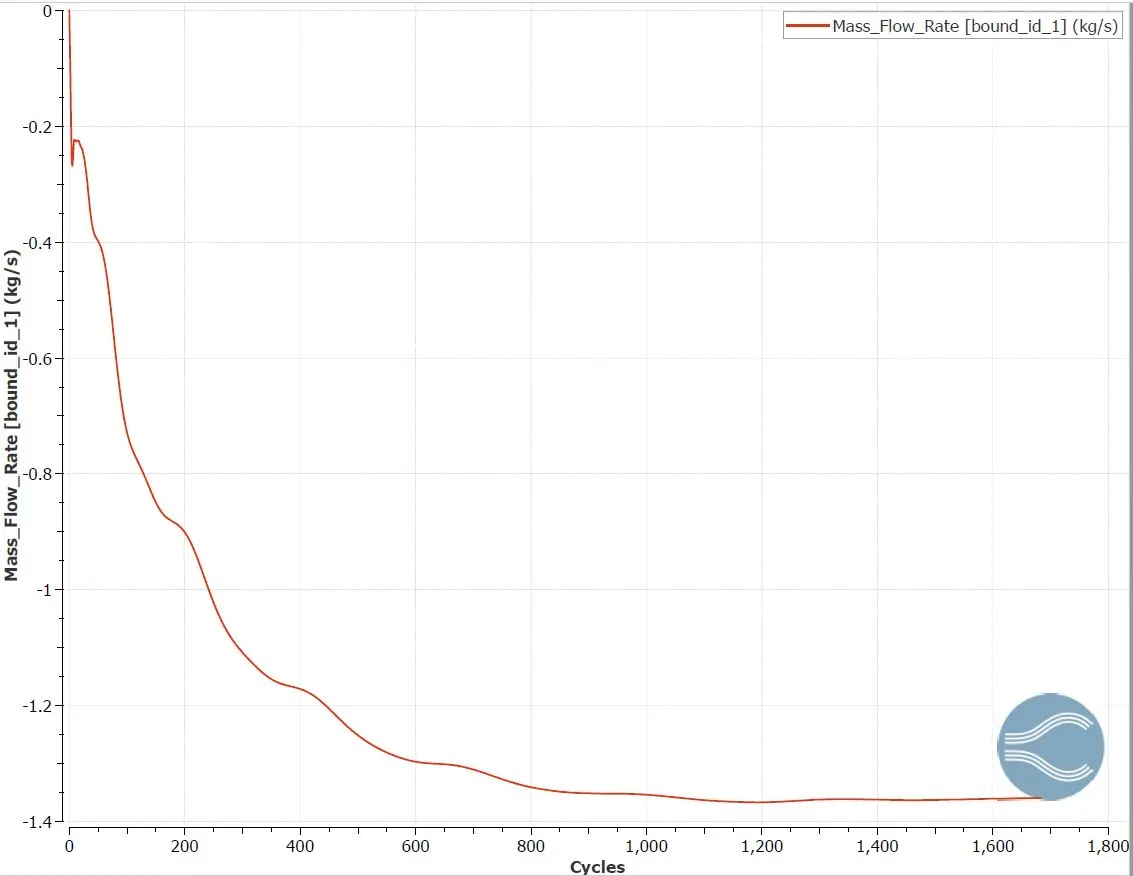
The mass flow rate at the inlet is recorded which is close to -1.38 kg/s.
MASS FLOW RATE (OUTLET):
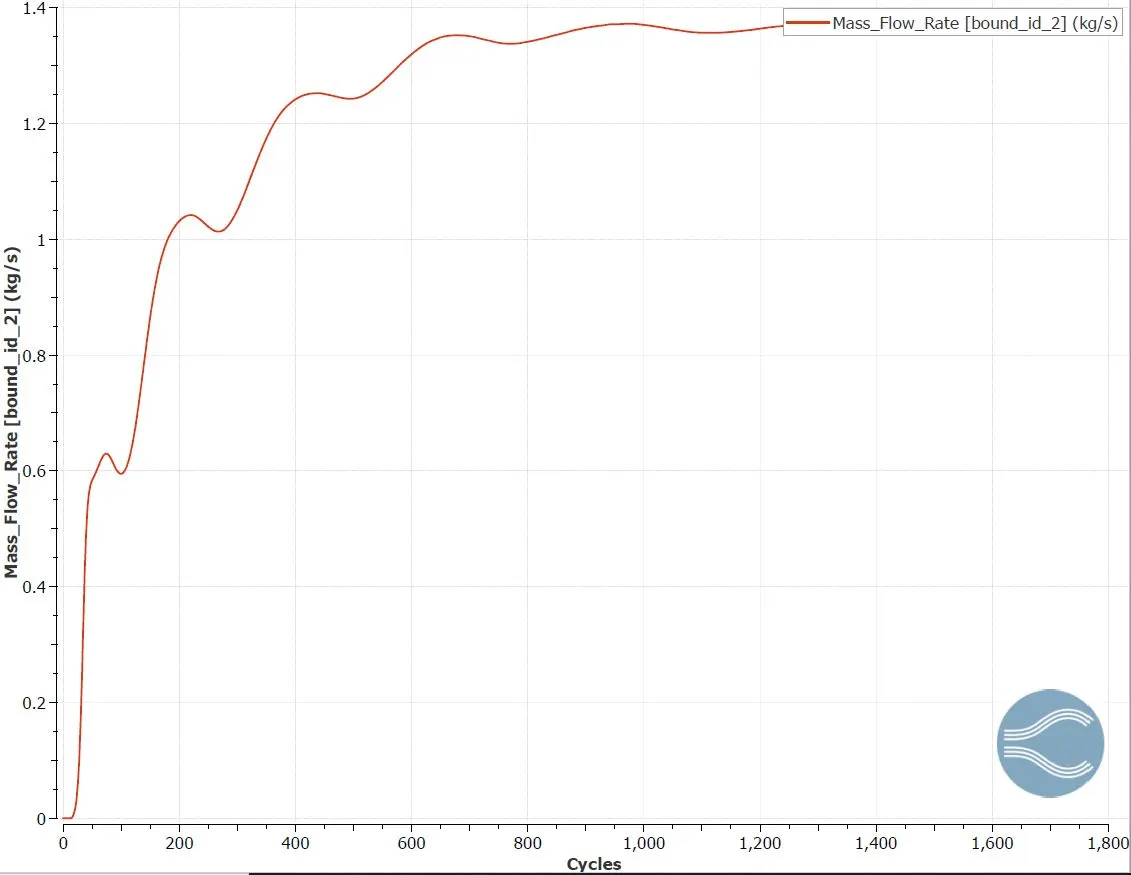
The mass flow rate at the outlet is recorded which is approximately equal to 1.38 kg/s.
TOTAL CELL COUNT:
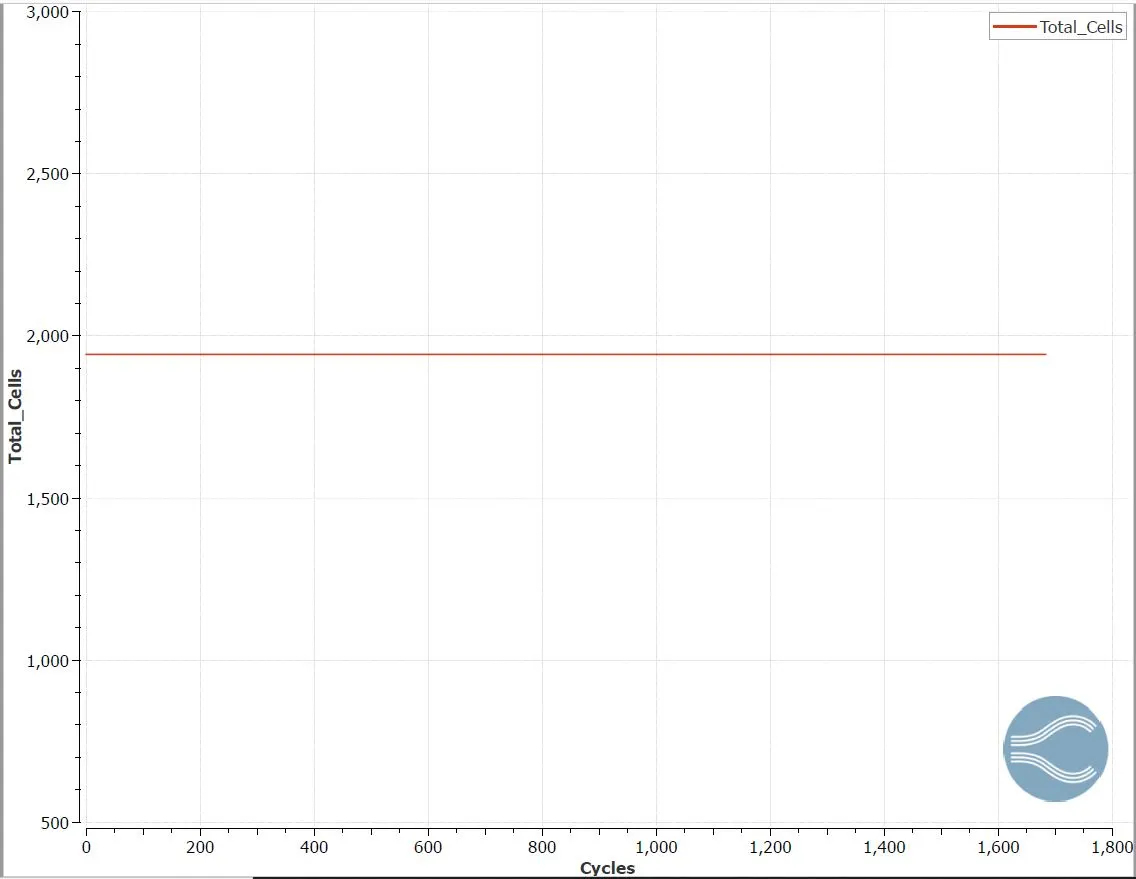
The total cell count for a mesh size of dx = dy = dz = 2e-3m, is approximately 1950 cells.
2) dx = dy = dz = 1.5e-3 m.
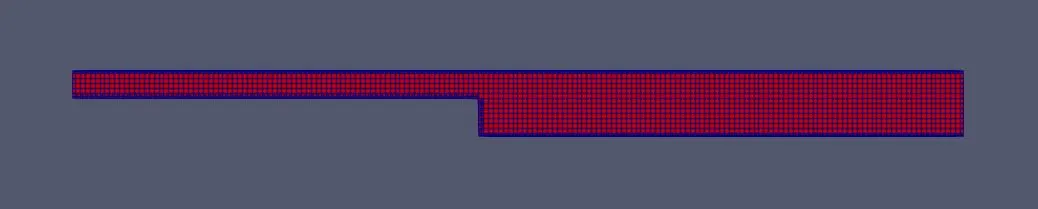
PRESSURE CONTOUR:
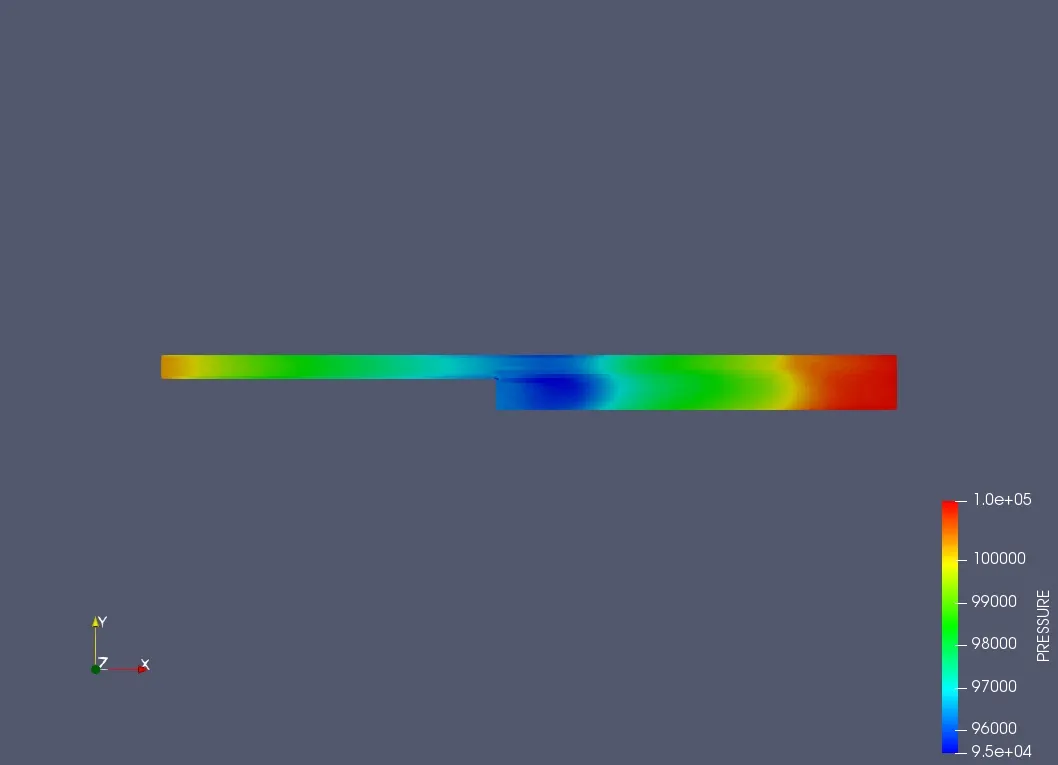
VELOCITY CONTOUR:
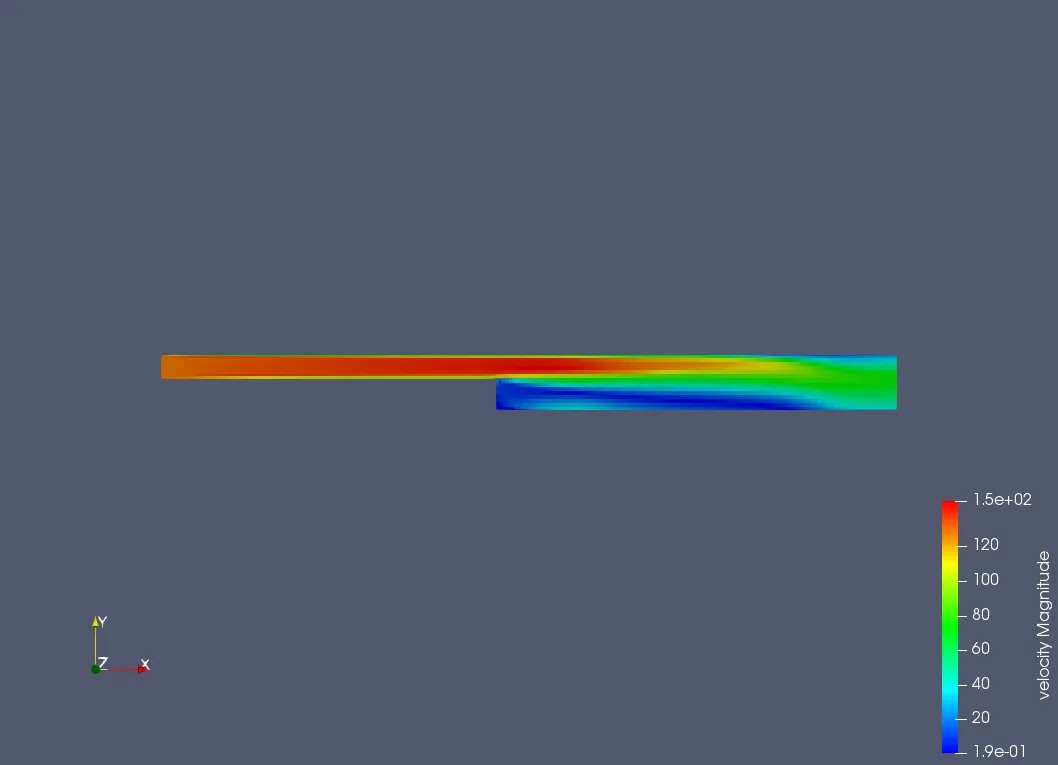
The area where the wake is formed is clearly displayed in the velocity contour in blue colour, where the velocity is low .
PLOTS:
PRESSURE PLOT (INLET):
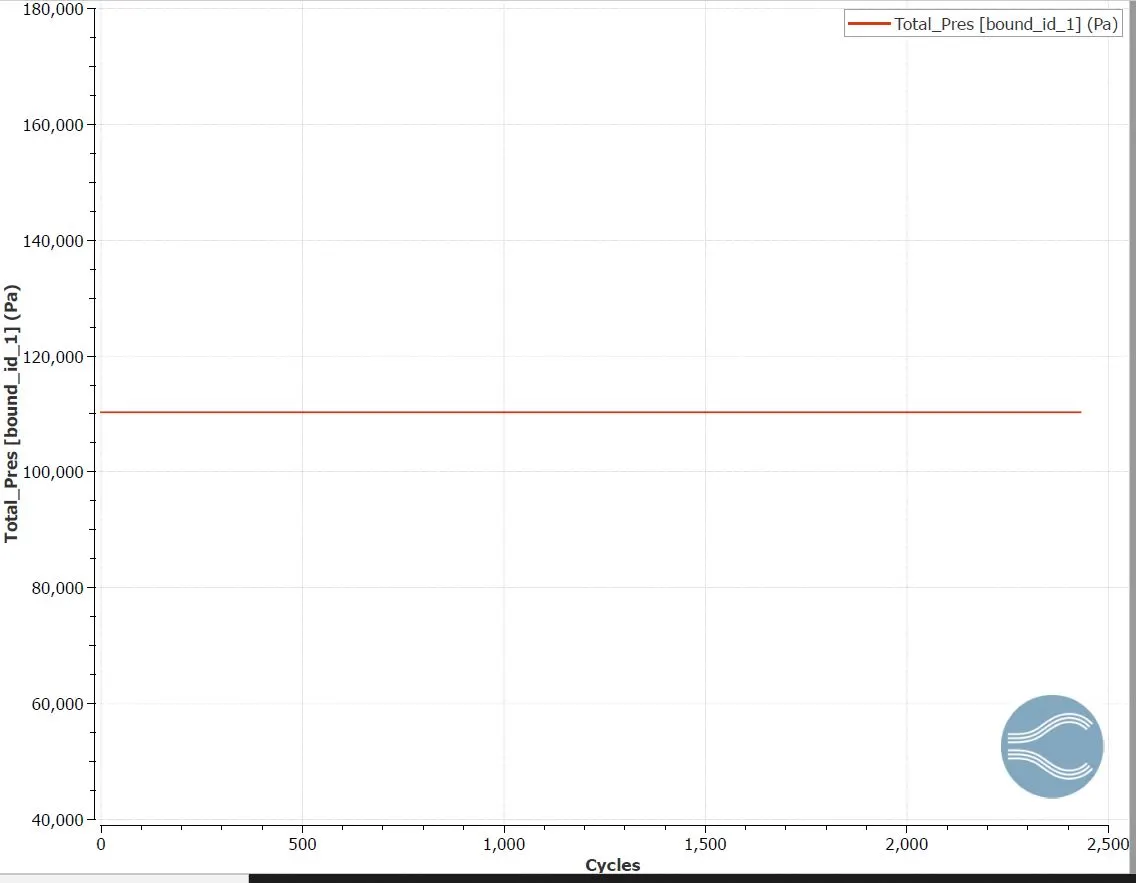
The boundary condition given in inlet is the total pressure displayed is 110325 Pa.
PRESSURE PLOT (OUTLET):
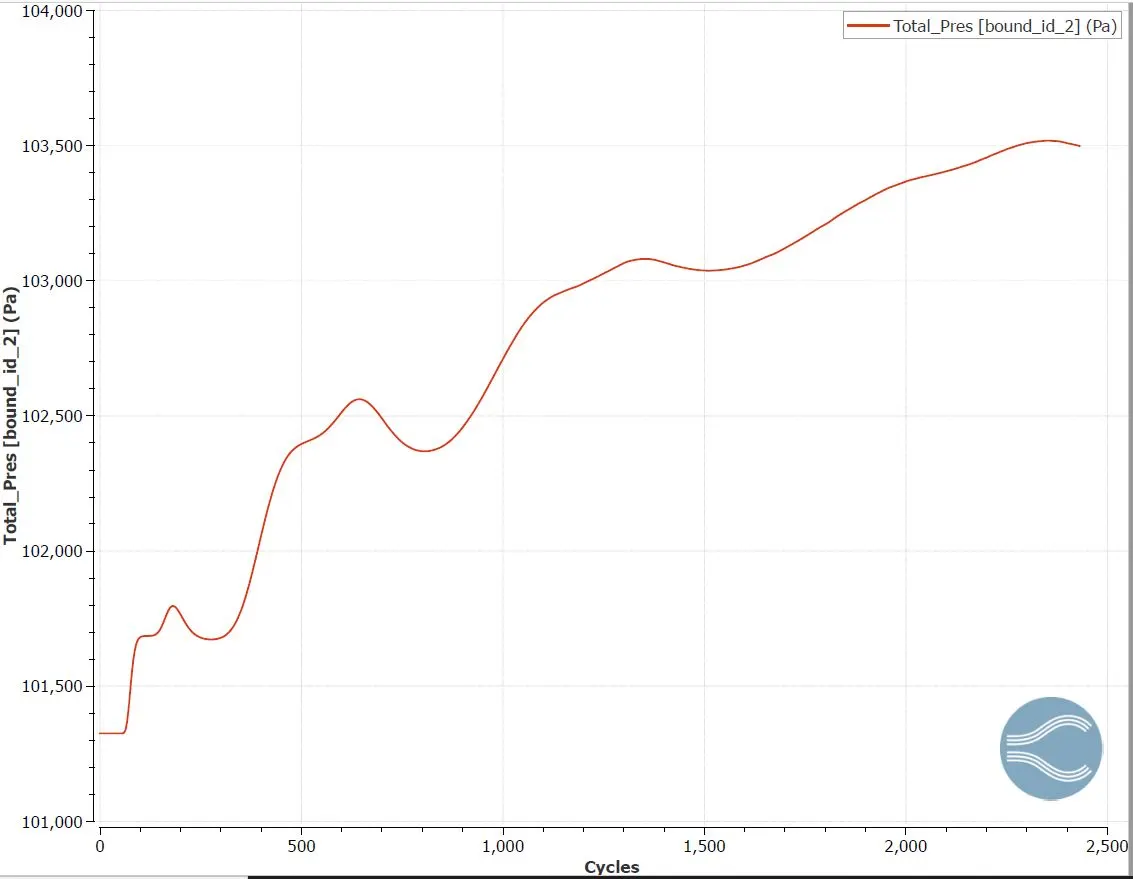
The total pressure in the outlet is displayed which is the summation of static pressure + dynamic pressure
VELOCITY PLOT (INLET):
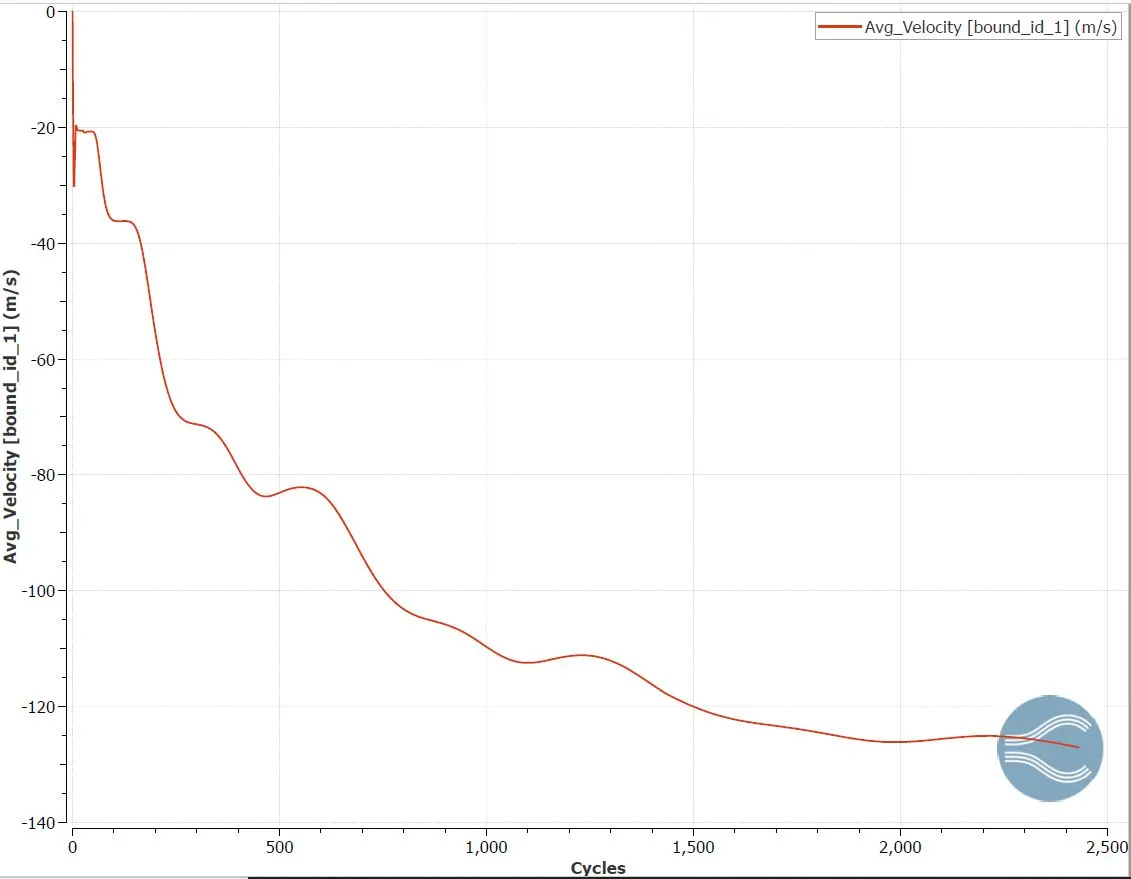
The average velocity at the inlet is recorded which is converged to approximately around 130 m/s.
VELOCITY PLOT (OUTLET):
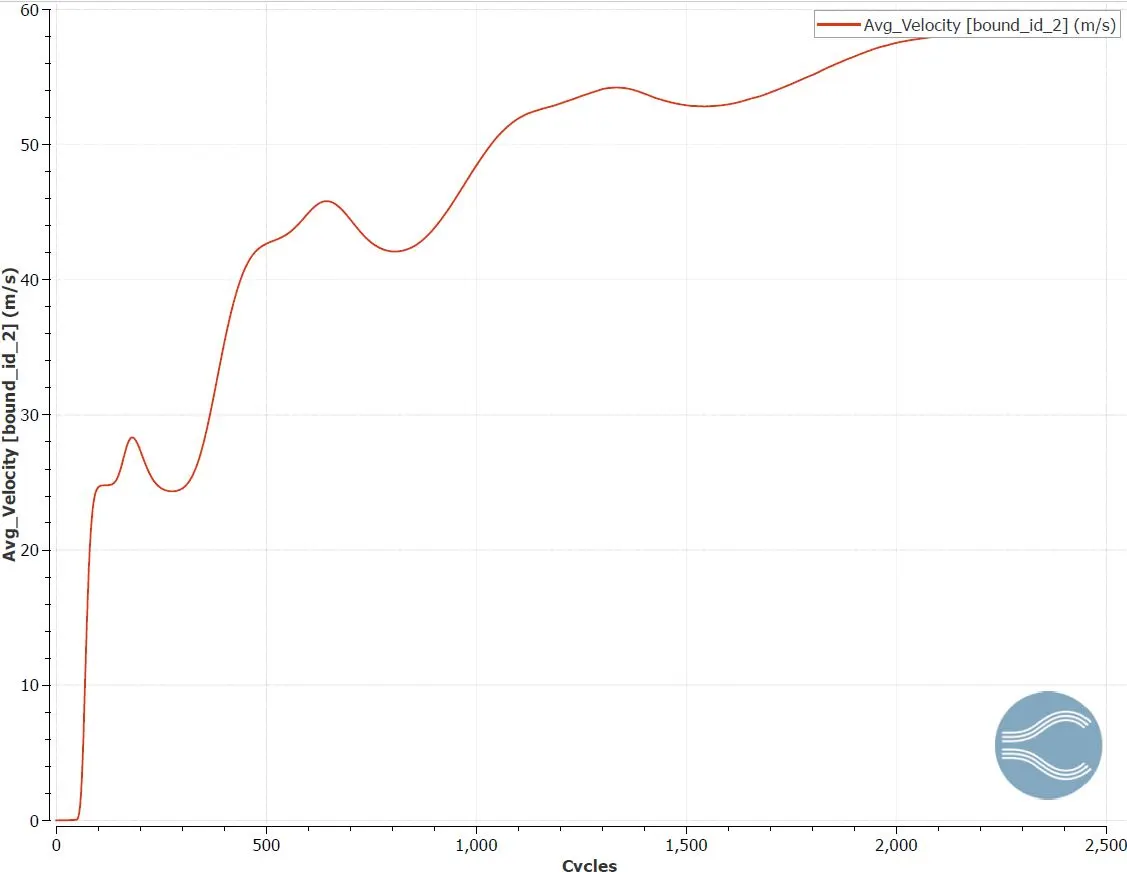
The average velocity measured at the outlet is recorded. This velocity is created due to the pressure difference of 9000 Pa.
MASS FLOW RATE (INLET):
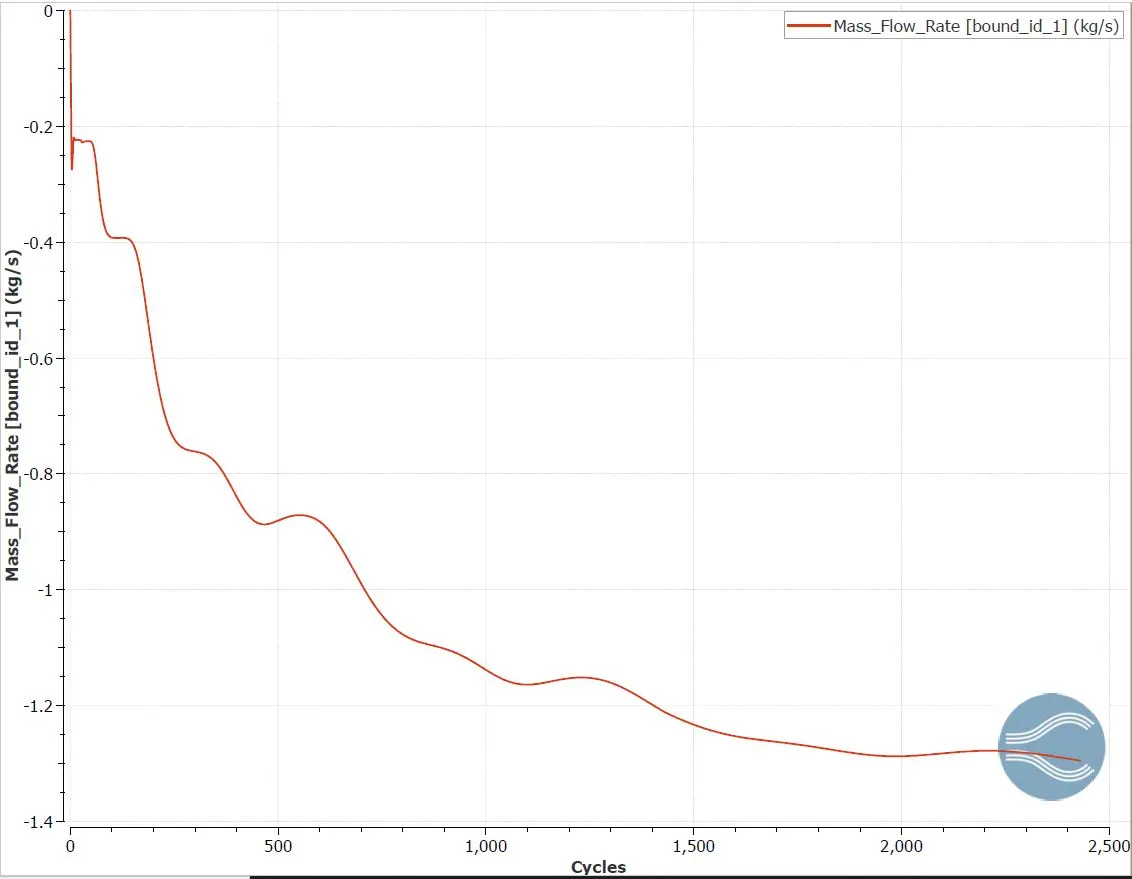
The mass flow rate at the inlet is recorded which is close to -1.38 kg/s.
MASS FLOW RATE (OUTLET):
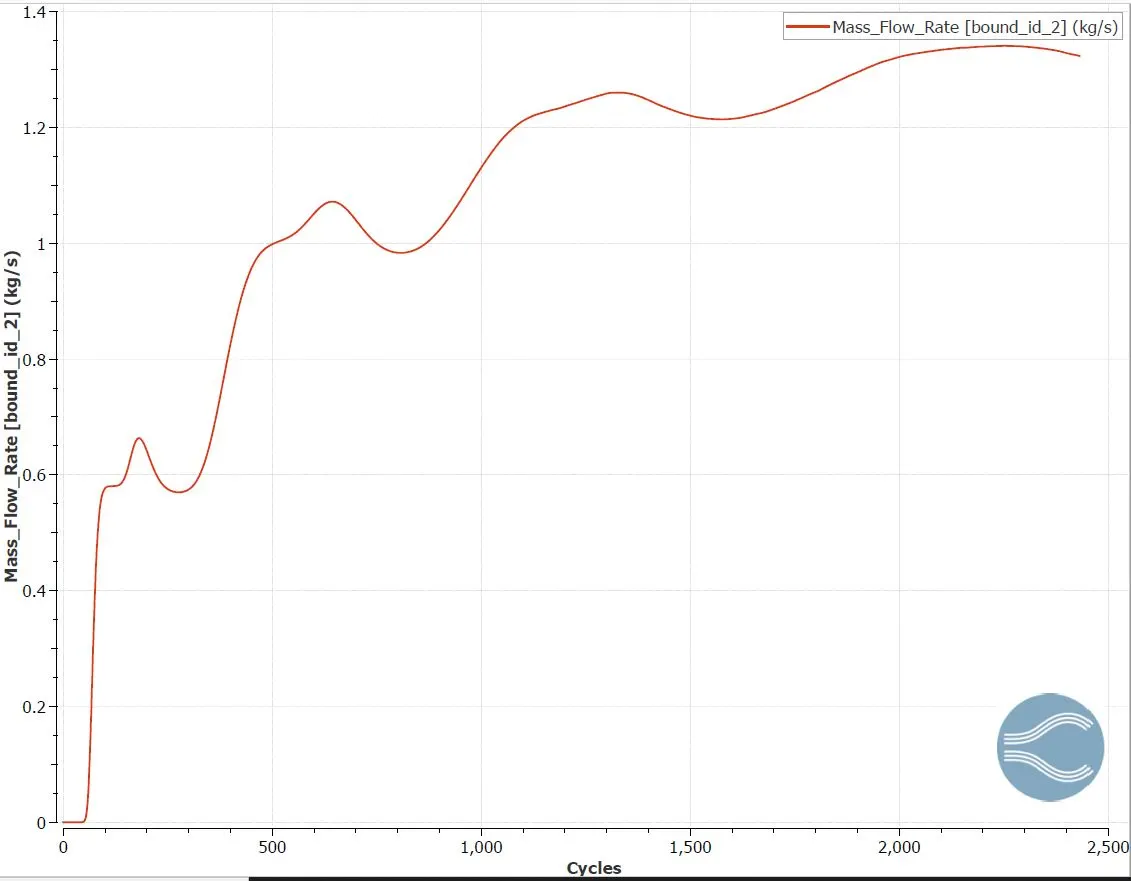
The mass flow rate at the outlet is recorded which is approximately equal to 1.38 kg/s.
TOTAL CELL COUNT:
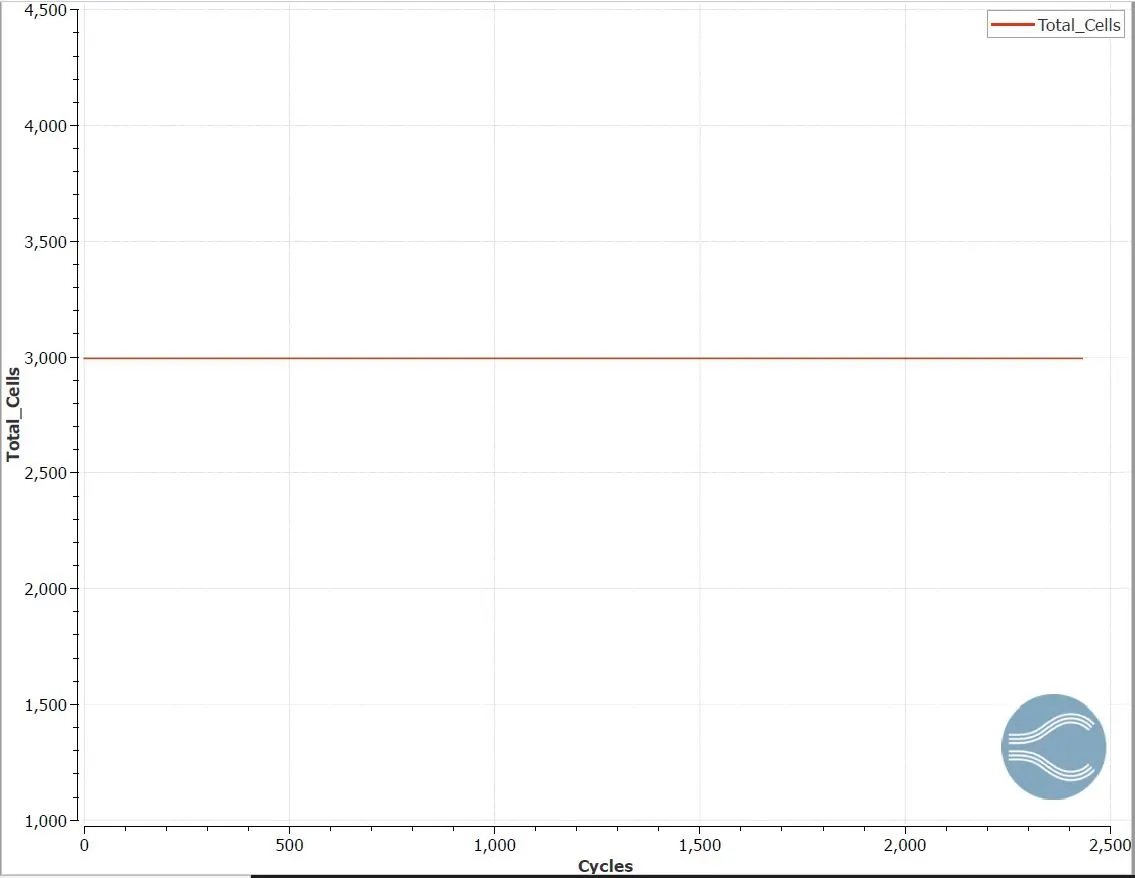
The total cell count for a mesh size of dx = dy = dz = 1.5e-3m, is approximately 3000 cells.
3) dx = dy = dz = 1.0e-3 m.

PRESSURE CONTOUR:
VELOCITY CONTOUR:
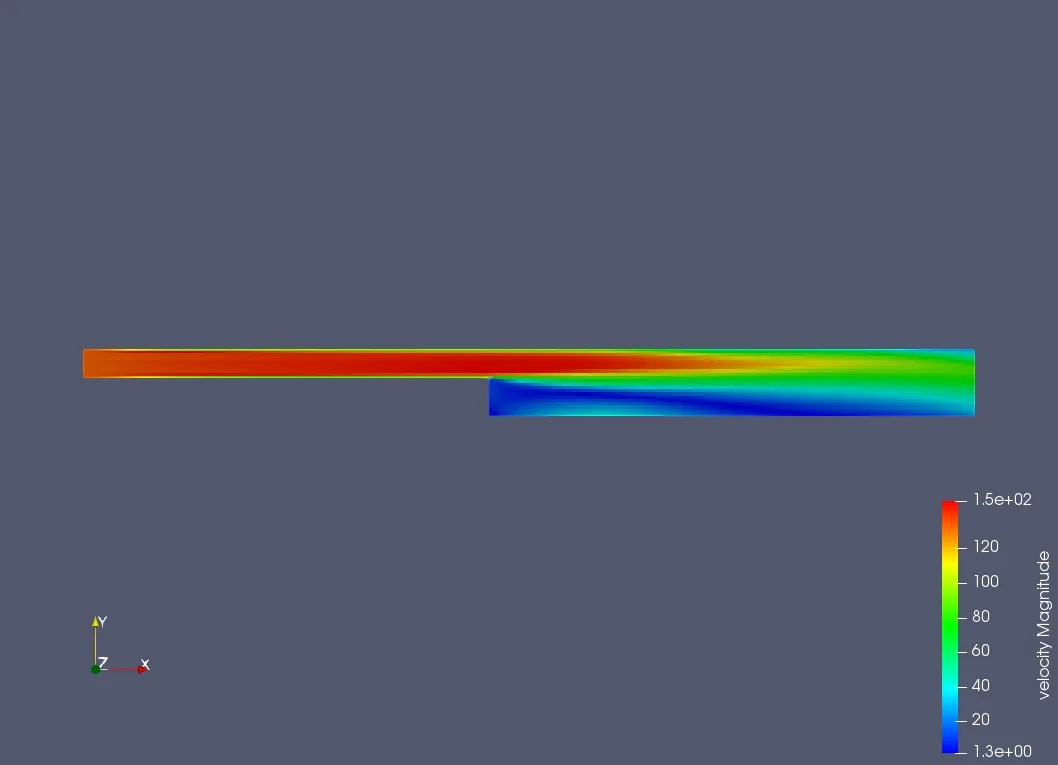
The area where the wake is formed is clearly displayed in the velocity contour in blue colour, where the velocity is low .
PLOTS:
PRESSURE PLOT (INLET):
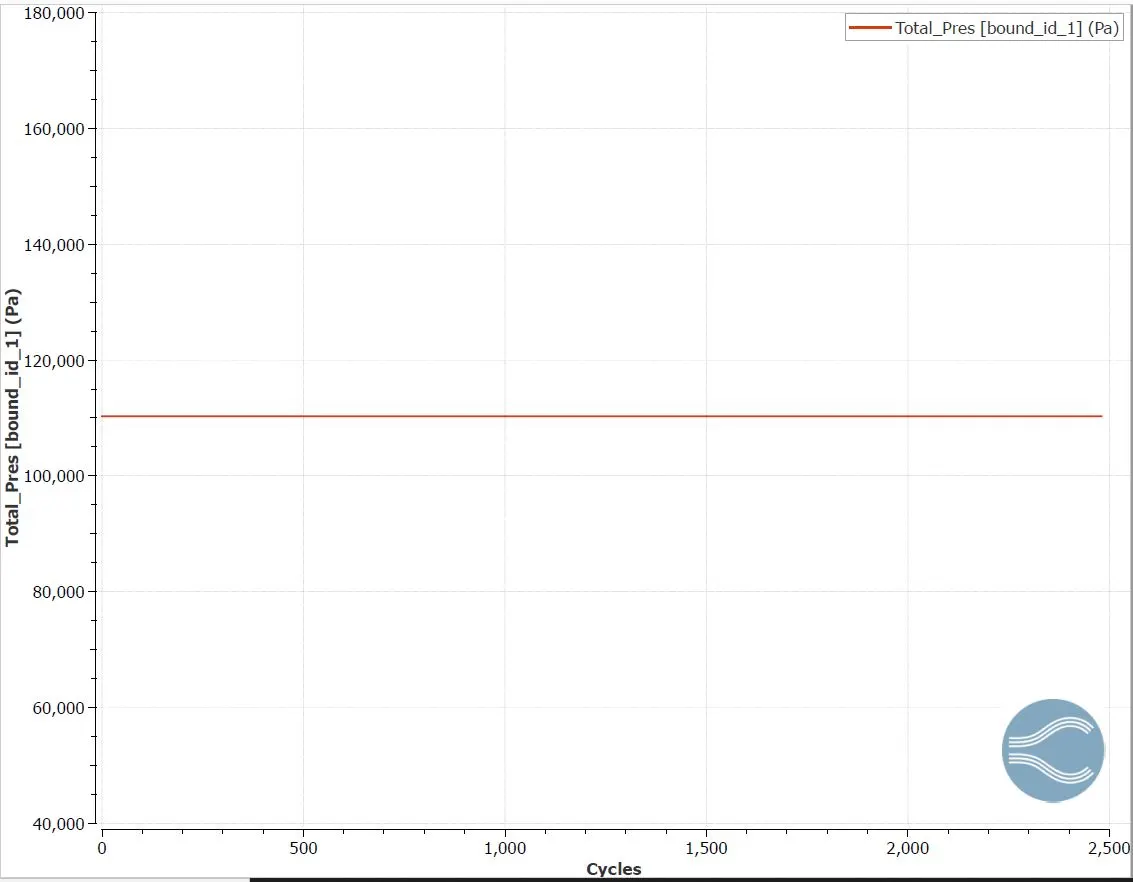
The boundary condition given in inlet is the total pressure displayed is 110325 Pa.
PRESSURE PLOT (OUTLET):
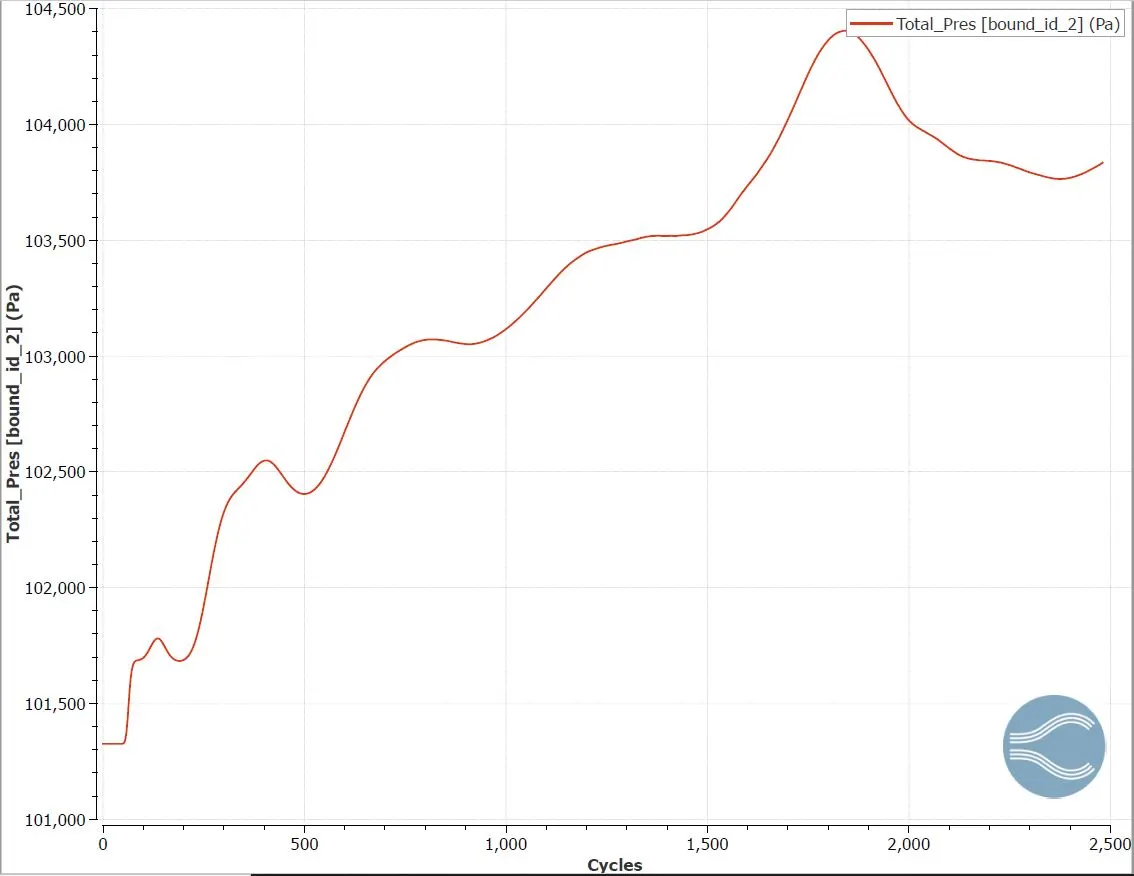
The total pressure in the outlet is displayed which is the summation of static pressure + dynamic pressure
VELOCITY PLOT (INLET):
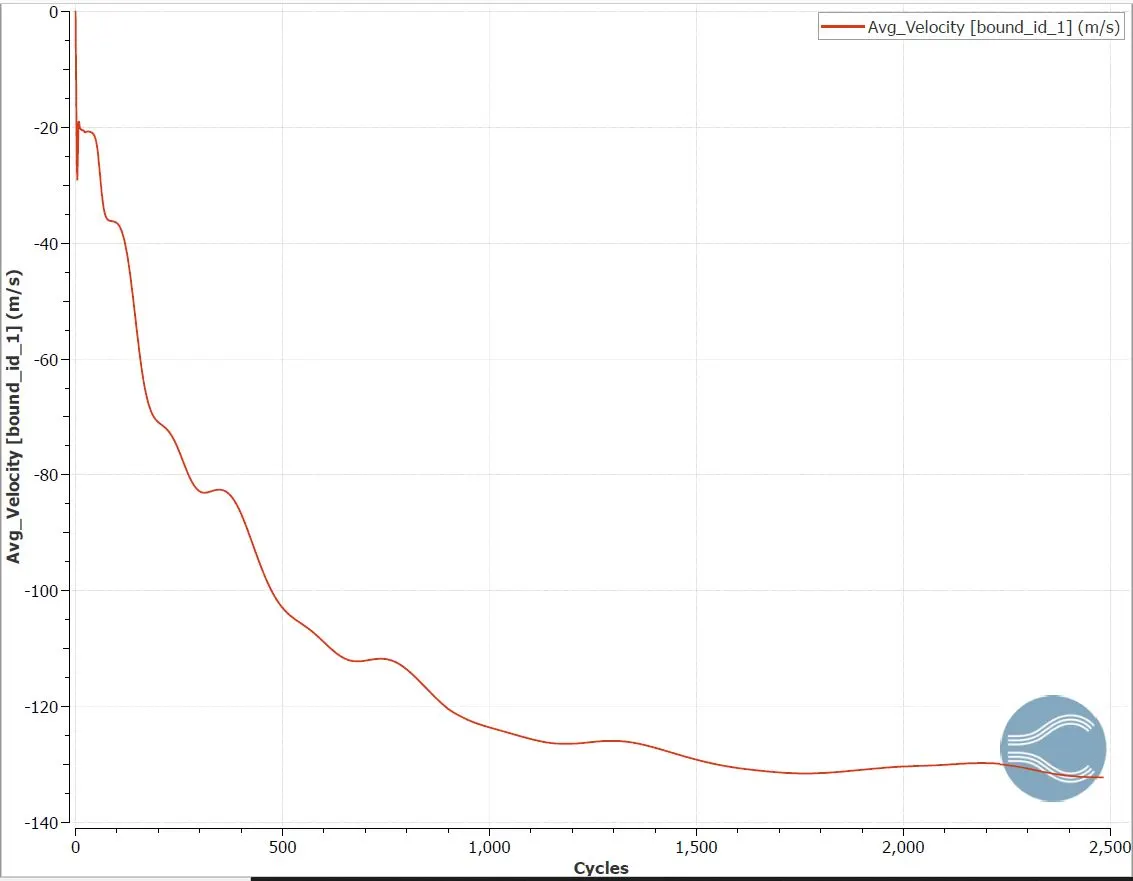
The average velocity at the inlet is recorded which is converged to approximately around 130 m/s.
VELOCITY PLOT (OUTLET):
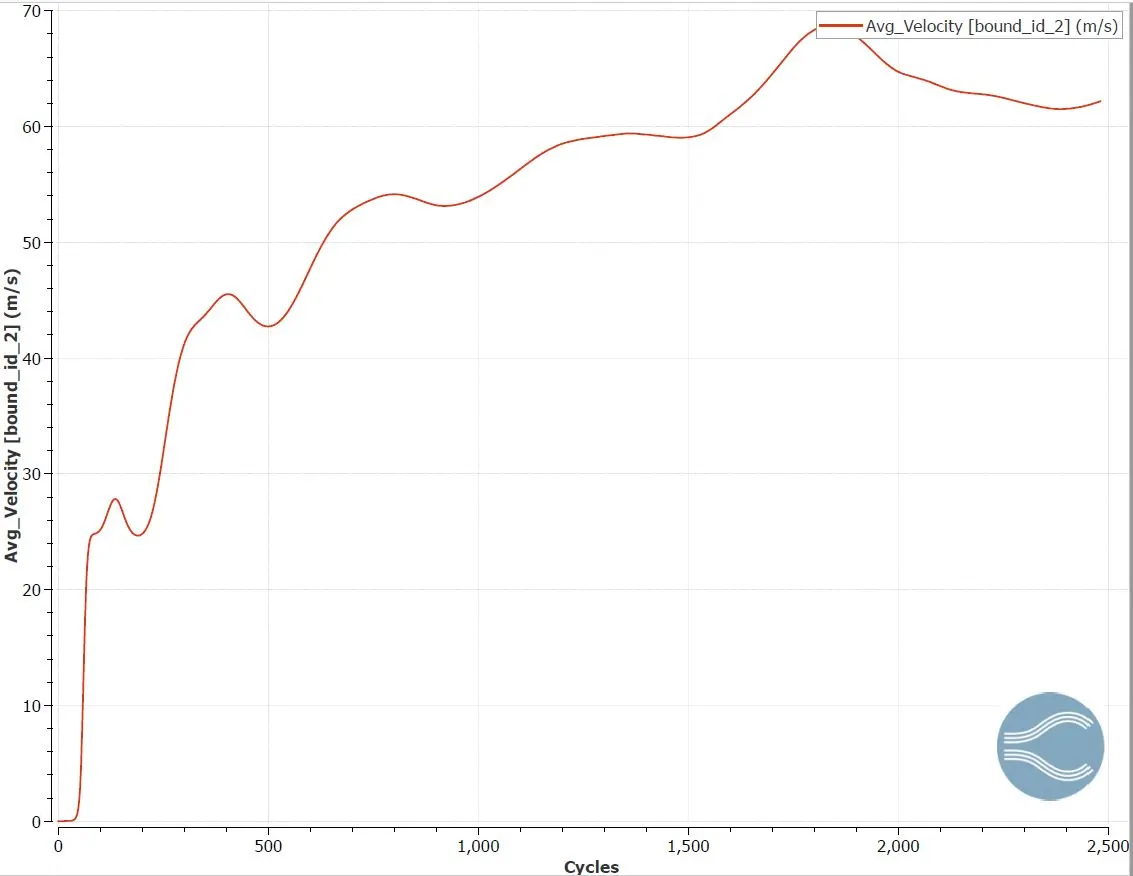
The average velocity measured at the outlet is recorded. This velocity is created due to the pressure difference of 9000 Pa.
MASS FLOW RATE (INLET):
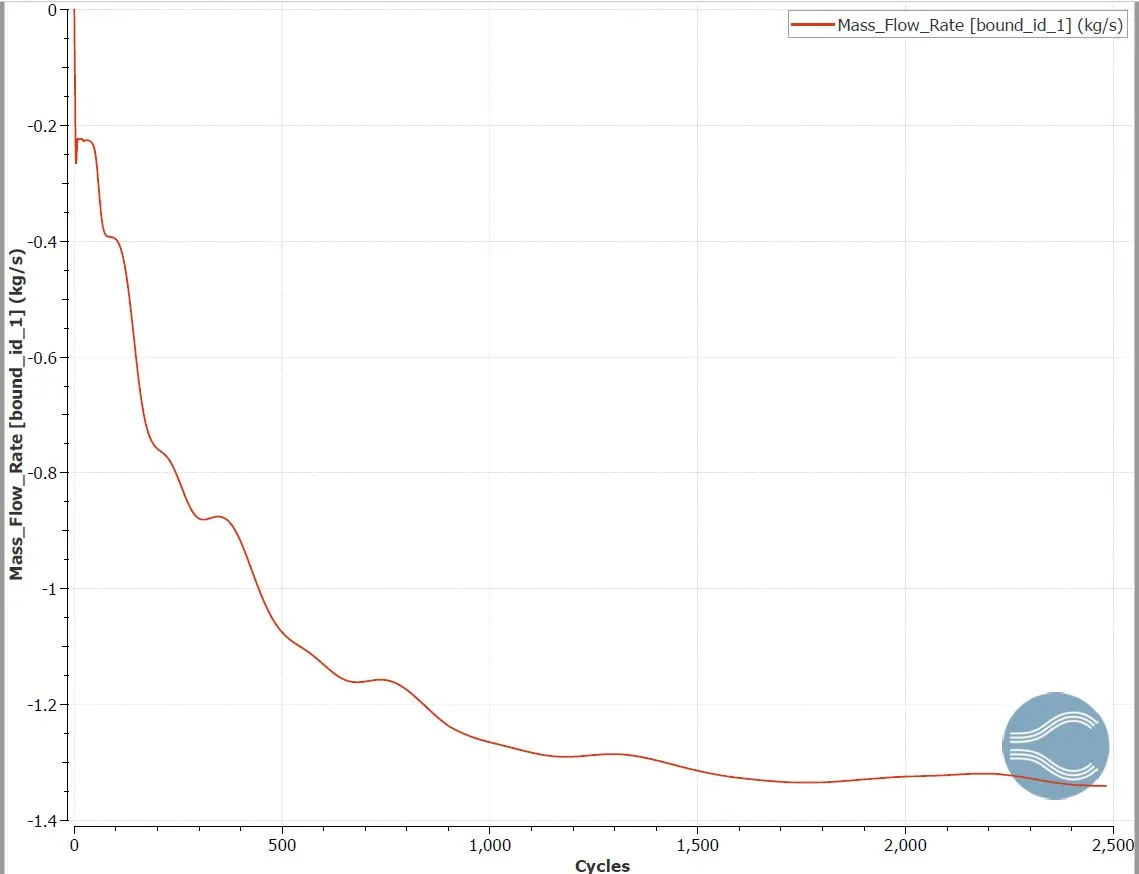
The mass flow rate at the inlet is recorded which is close to -1.38 kg/s.
MASS FLOW RATE (OUTLET):
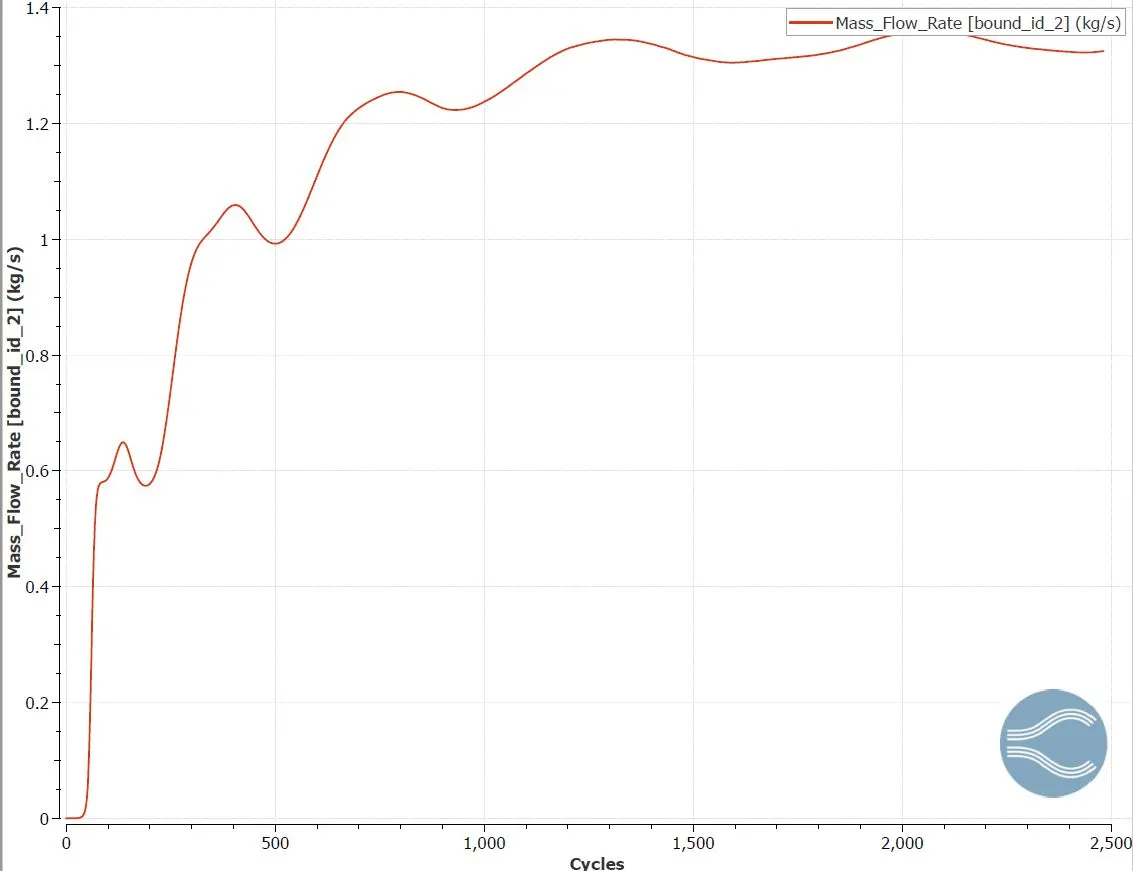
The mass flow rate at the outlet is recorded which is approximately equal to 1.38 kg/s.
TOTAL CELL COUNT:
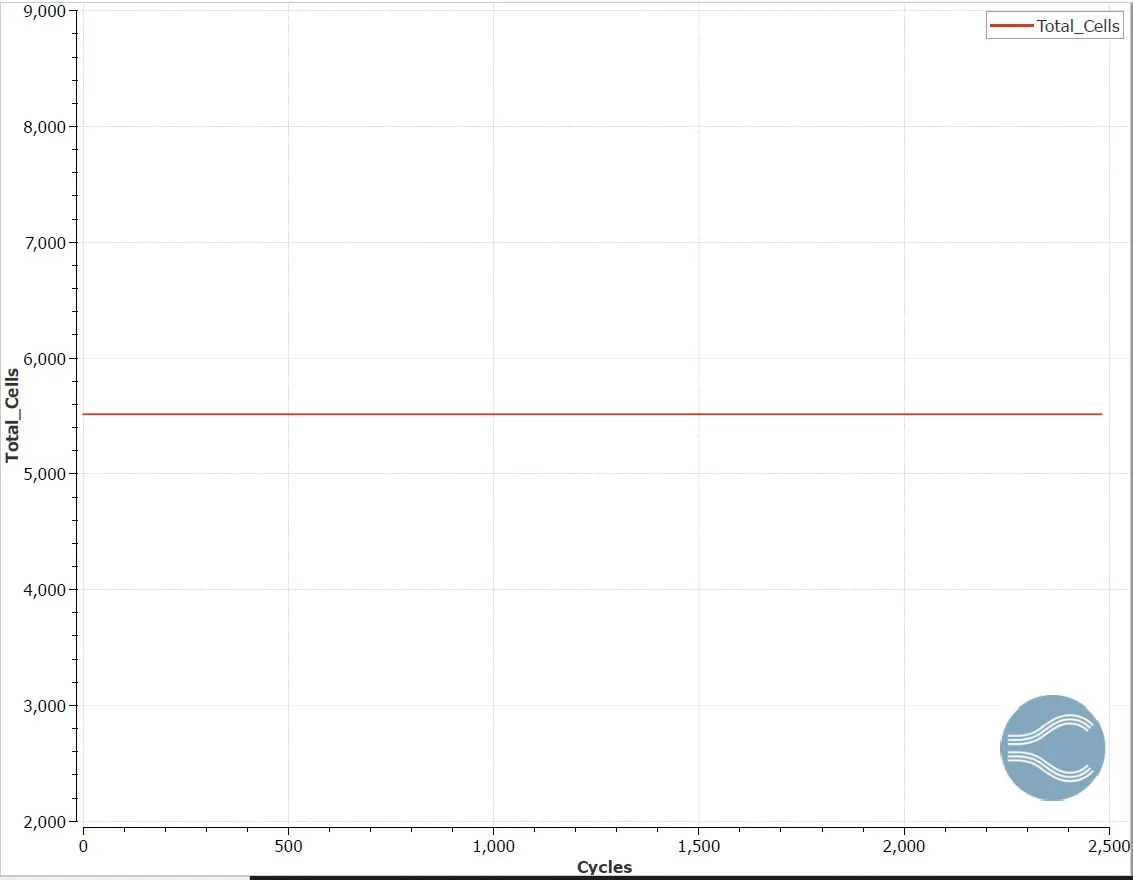
The total cell count for a mesh size of dx = dy = dz = 1e-3m, is approximately 5500 cells
CONCLUSION:
The flow is simulated through a backward facing step and basic concepts were understood on flow seperation and the effect of grid size on the number of cells count.
The reason for seperation is shown below with an image:
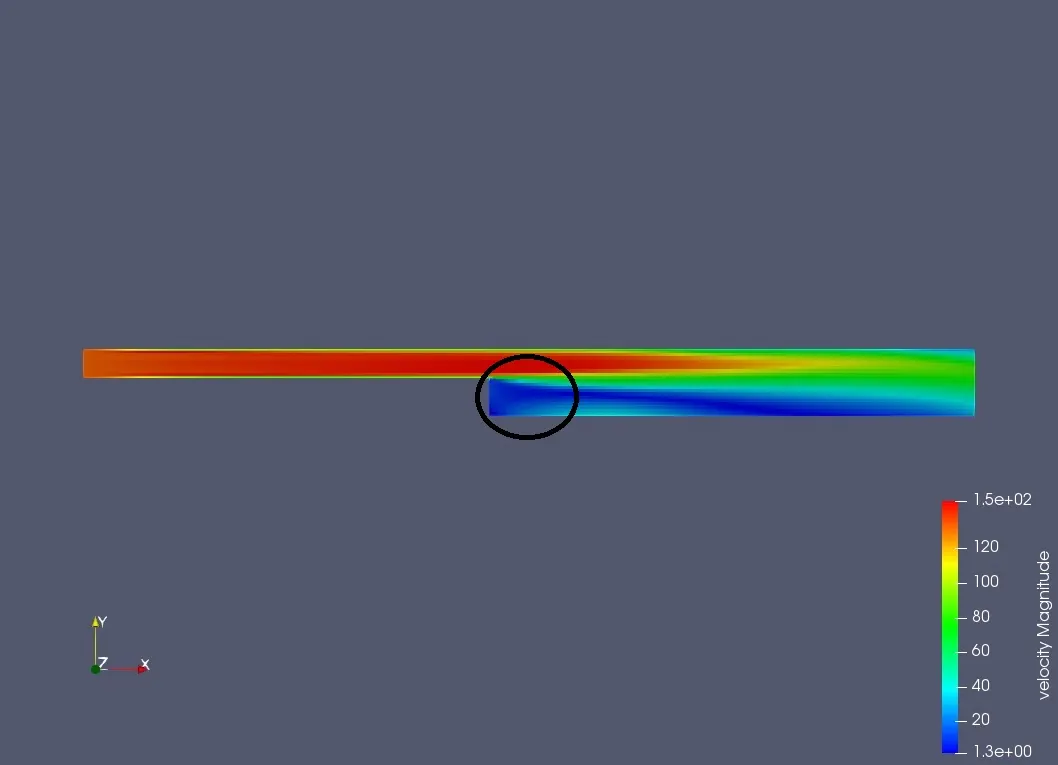
The area where separation takes place is marked. This happens due to the step shape , where the flow fails to attach and flows continues to take place along the path of the smaller section, leaving a wake region below it, where the flow becomes unstable.
ANIMATION LINK: https://drive.google.com/file/d/190OJGAAzHrPb9T0NaSpnetwjmNWz3Ahn/view?usp=sharing