Report on curve fitting
Title: Curve fitting.
Aim: Using given thermodynamic data match the curve as from the data with minimum errors.
Objective of the project:
- Predict the correct degree of equation for the given thermodynamic data.
- The distance between actual graph and predicted graph should be minimum as such as possible.
Procedure:
- Load the data file.
- Assigned the variables.
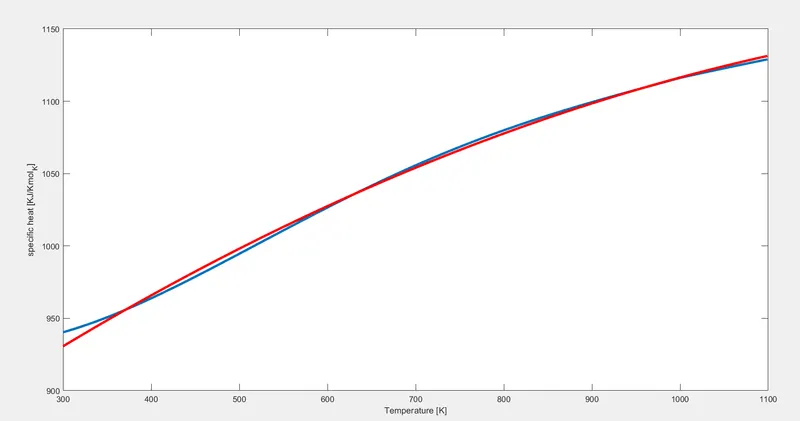
- Split the data in 4 equal parts.
- Make code for each part and made separate figure window for each.
- The written code is given as below.
clear all
close all
clc
cp_data = load('data');
temperature = cp_data(:,1);
cp = cp_data(:,2);
cp1=cp(1:800);
temperature1=temperature(1:800);
% Curve fit
% cp = a*T^2 + b*T + c
co_effs1 = polyfit(temperature1,cp1,2);
predicted_cp1 = polyval(co_effs1, temperature1);
figure(1)
% Compare my curve fit with the original data
plot(temperature1, cp1, 'linewidth',3);
xlabel('Temperature [K]');
ylabel('specific heat [KJ/Kmol_K]');
hold on
plot(temperature1, predicted_cp1,'linewidth' ,3, 'color','r');
cp_data = load('data');
temperature = cp_data(:,1);
cp = cp_data(:,2);
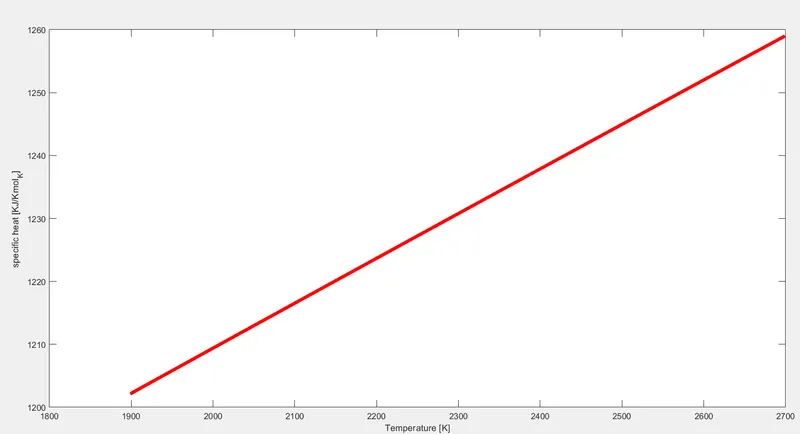
cp2=cp(800:1600);
temperature2=temperature(800:1600);
% Curve fit
% cp = a*T^2 + b*T + c
co_effs2 = polyfit(temperature2,cp2,2);
predicted_cp2 = polyval(co_effs2, temperature2);
figure(2)
% Compare my curve fit with the original data
plot(temperature2, cp2, 'linewidth',3);
xlabel('Temperature [K]');
ylabel('specific heat [KJ/Kmol_K]');
hold on
plot(temperature2, predicted_cp2,'linewidth' ,3, 'color','r');
cp_data = load('data');
temperature = cp_data(:,1);
cp = cp_data(:,2);
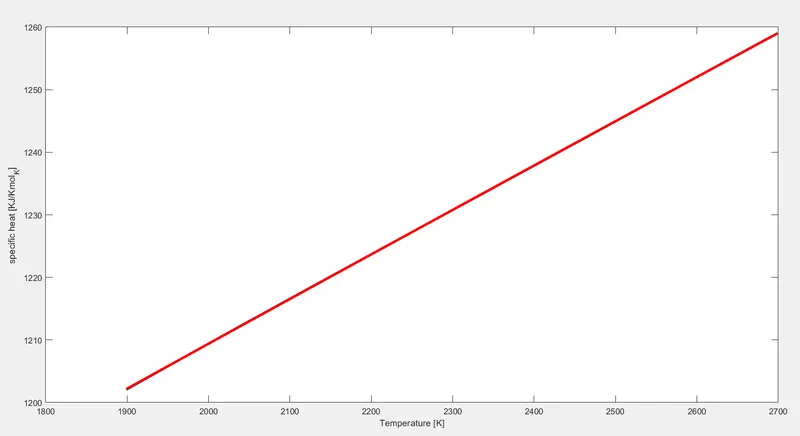
cp3=cp(1600:2400);
temperature3=temperature(1600:2400);
% Curve fit
% cp = a*T^2 + b*T + c
co_effs3 = polyfit(temperature3,cp3,2);
predicted_cp3 = polyval(co_effs3, temperature3);
figure(3)
% Compare my curve fit with the original data
plot(temperature3, cp3, 'linewidth',3);
xlabel('Temperature [K]');
ylabel('specific heat [KJ/Kmol_K]');
hold on
plot(temperature3, predicted_cp3,'linewidth' ,3, 'color','r');
cp_data = load('data');
temperature = cp_data(:,1);
cp = cp_data(:,2);
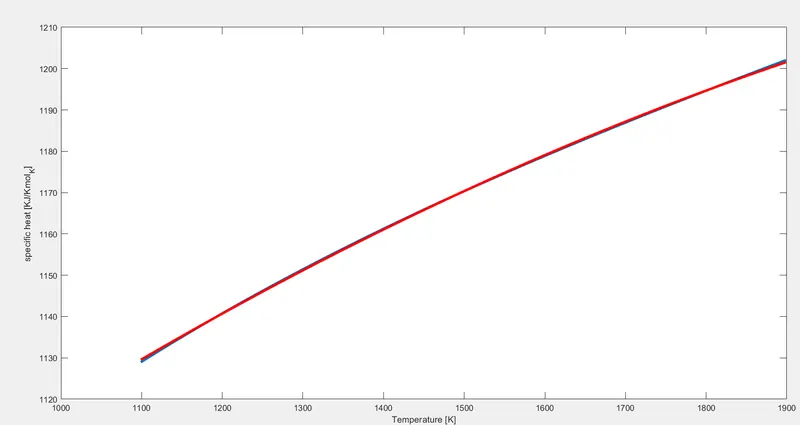
cp4=cp(1600:2400);
temperature4=temperature(1600:2400);
% Curve fit
% cp = a*T^2 + b*T + c
co_effs4 = polyfit(temperature4,cp4,2);
predicted_cp4 = polyval (co_effs4, temperature4);
figure(4)
% Compare my curve fit with the original data
plot(temperature4, cp4, 'linewidth',3);
xlabel('Temperature [K]');
ylabel('specific heat [KJ/Kmol_K]');
hold on
plot(temperature4, predicted_cp4,'linewidth' ,3, 'color','r');
Error while writing a code:
- If we try to write a code for a full data in a one graph then there is huge possibility of getting error.
- To overcome this type of error and matching the curves I split the data in 4 equal parts.
- And wrote the separate code for each.