Rayleigh Taylor Instability Challenge
Rayleigh Taylor instability
Theory:
The Rayleigh–Taylor instability, or RT instability is an instabilityof an interface between two fluids of different densities which occurs when the lighter fluid is pushing the heavier fluid.The equilibrium here is unstable to any perturbations or disturbances of the interface, if a parcel of heavier fluid is displaced downward with an equal volume of lighter fluid displaced upwards, the potential energy of the configuration is lower than the initial state. Thus the disturbance will grow and lead to a further release of Potential energy, as the more dense material moves down under the (effective) gravitational field, and the less dense material is further displaced upwards. This was the set-up as studied by Lord Rayleigh.The important insight by G. I. Taylor was his realisation that this situation is equivalent to the situation when the fluids are accelerated, with the less dense fluid accelerating into the more dense fluid. This occurs deep underwater on the surface of an expanding bubble and in a nuclear explosion.
As the RT instability develops, the initial perturbations progress from a linear growth phase into a non-linear growth phase, eventually developing "plumes" flowing upwards (in the gravitational buoyancy sense) and "spikes" falling downwards. In the linear phase, the fluid movement can be closely approximated by linear equations, and the amplitude of perturbations is growing exponentially with time. In the non-linear phase, perturbation amplitude is too large for a linear approximation, and non-linear equations are required to describe fluid motions.
Some practical CFD models that have been based on the mathematical analysis of Rayleigh Taylor waves:
Kelvin–Helmholtz instability: The Kelvin–Helmholtz instability typically occurs when there is velocity shear in a single continuous fluid, or additionally where there is a velocity difference across the interface between two fluids. A common example is seen with wind blowing over water, the instability constant is able to manifest itself through waves on a water surface.
The Kelvin-Helmholtz instability phenomena is an all encompassing occurrence of fluid flow seen time and time again in nature. From the waves of the ocean to the clouds above in the sky, the Kelvin-Helmholtz instability is responsible for some of nature's most basic structures. Further analysis and modeling of the Kelvin-Helmholtz instability can result in an understanding of the worlds natural phenomena and more.
Richtmyer–Meshkov instability: The Richtmyer–Meshkov instability (RMI) occurs when two fluids of different density are impulsively accelerated. Normally this is by the passage of a shock wave. The development of the instability begins with small amplitude perturbations which initially grow linearly with time. This is followed by a nonlinear regime with bubbles appearing in the case of a light fluid penetrating a heavy fluid, and with spikes appearing in the case of a heavy fluid penetrating a light fluid. A chaotic regime eventually is reached and the two fluids mix. This instability can be considered the impulsive-acceleration limit of the Rayleigh-Taylor instability.
Plateau–Rayleigh instability: The Plateau–Rayleigh instability, often just called the Rayleigh instability, explains why and how a falling stream of fluid breaks up into smaller packets with the same volume but less surface area. It is related to the Plateau–Rayleigh instability and is part of a greater branch of fluid dynamics concerned withfluid thread breakup. This fluid instability is exploited in the design of a particular type of ink jet technology whereby a jet of liquid is perturbed into a steady stream of droplets
The driving force of the Plateau–Rayleigh instability is that liquids, by virtue of their surface tension, tend to minimize their surface area. A considerable amount of work has been done recently on the final pinching profile by attacking it with self-similar solutions.
Simulation Data :
Geometrical model
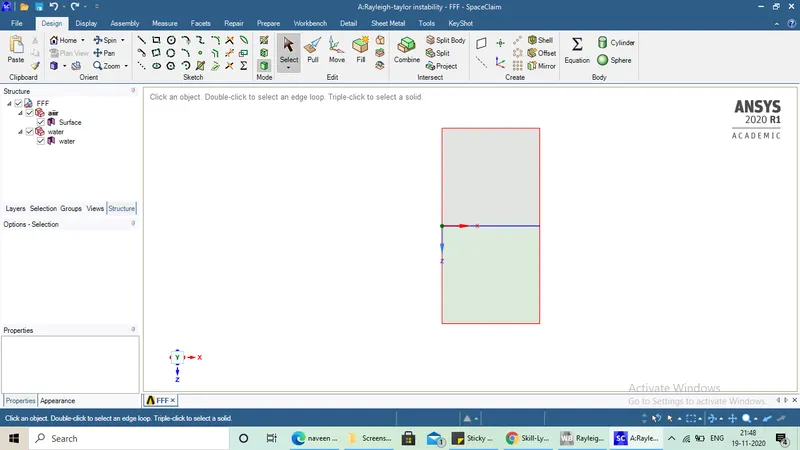
The model has been simple, generated using sketch tools and surfaces(air and water) have been generated using pull tool as it is fairly a 2D simulation. Both the surfacees have been shared using shareprep tool for topology share of both the surfaces for flow of information between them.
Meshing
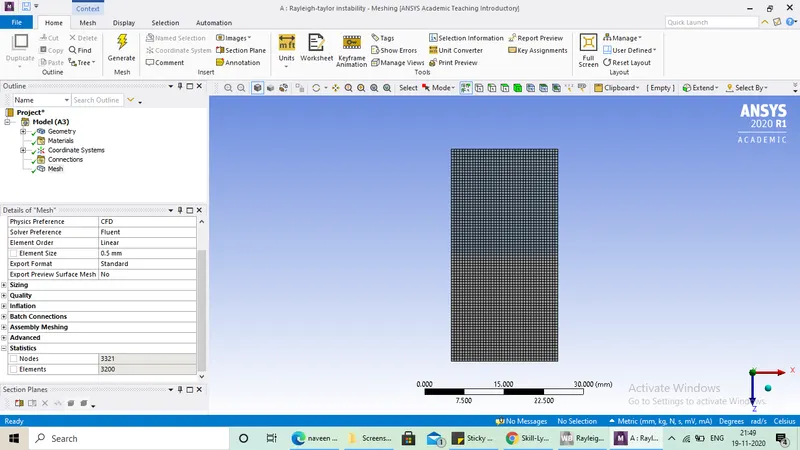
Basic mesh with element size of 0.5mm and Hexahedral mesh as it is a 2d rectangular geometry and no refinement has been done.
Number of elements: 3200
Solving setup:
As this is a multiphase modelling problem Volume of fluid method is used where 2 Eulerian phases have been idenified with primary phase being air and secondary phase being water.
Solver info : pressure based, Transient method gravity enabled in negative Y direction with magnitude of 9.81
Numerical approach for calucluating solution: Implicit method
Time step size :0.005
No.of time steps :1000
Initializatin :Standard
Patching is done after initialization to describe the volume fraction of water.
`alpha1+alpha2=1`, where `alpha1`=volume fraction of water
`alpha2`=volume fraction of air
Properties of water: Density -998.2 kg/m^3;
viscosity-0.001003 kg/m-s
Properties of air: Density-1.225 kg/m^3;
viscosity-1.7894e-05 kg/m-s;
Solution: Case-1
Higher density material -water
lower density material-air
mesh -Basic 0.5mm
Residuals:
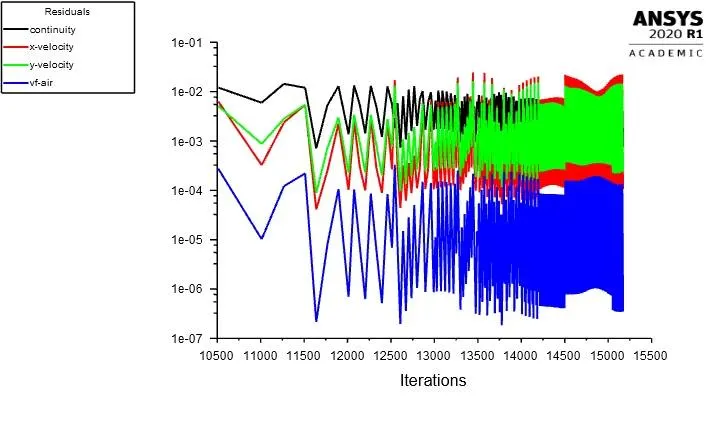
As it is transient approach residulas will not reach to steady state but the solution is run till required number of iterations ,hence assumed the solution to be converged .
Solution Animation:
Solution: Case-2
Higher density material -water
lower density material-air
mesh -Basic 0.1 mm
Mesh :
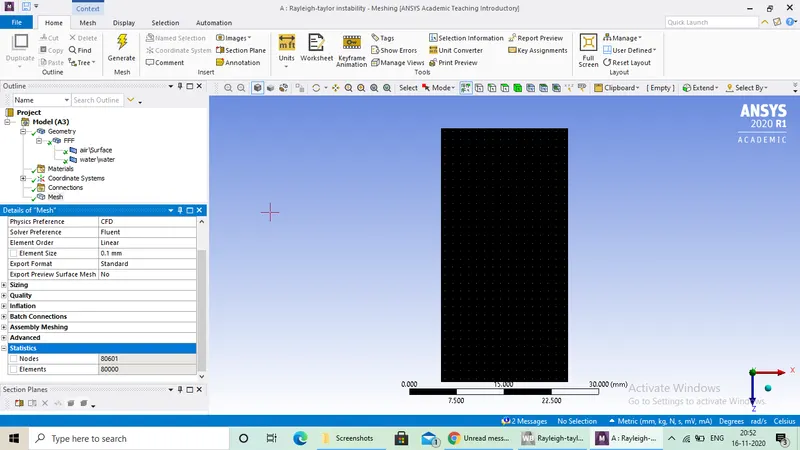
all the settings in the fluent are same except mesh refnement ,hence not repeated full setup parameters.
Residuals:
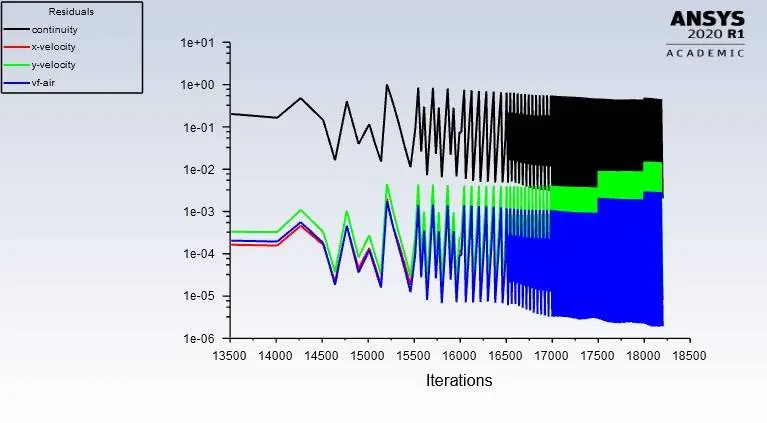
Solution Animation:
Solution: Case-3
Higher density material -water
lower density material-user defined
mesh -Basic 0.1 mm
properties of user defined material:
Density-400 kg/m^3;
viscosity-0.001 kg/m-s;
all the settings in the fluent are same except above material change ,hence not repeated full setup parameters.
Residuals:
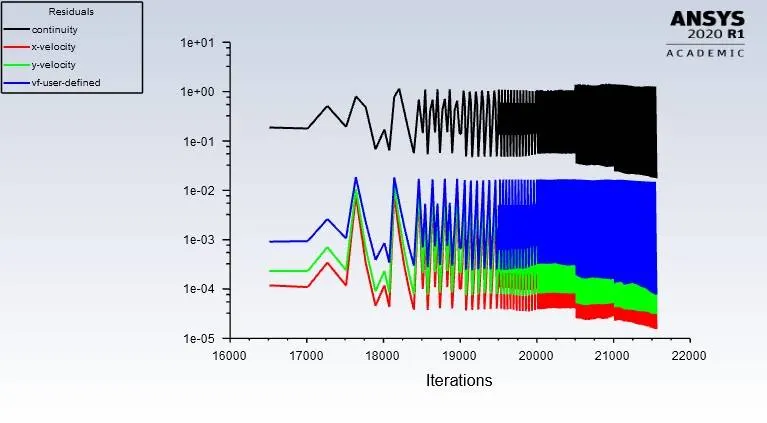
solution animation:
Effect of mesh size on simulation:
1) When elements size in the mesh decreases i.e, grid size decreases courant number increases as grid size is inversely proportional to courant number , hence we observe that solution after certain time steps starts to diverge instead of converging if the same time step is used which is used for basic mesh simulation.
`C=(u.deltat)/(deltax)` which should be <1A
2) To compensate the effect of grid size on courant number , time step has to be decreased so that our solution does not get diverged.This divergence can be observed in residuals plot where continuity curve raises drastically after certain point.
3) Initially when instablities develop between the interface of two different density fluids , spikes are observed when higher density fluid penetrates in to lower dense fluid and plumes are observed when lower density fluid penetrates in to more denser fluid, in the beginning these plumes coalesce to form small bubbles and then these bubbles from larger ones and collapses creating turbulance , but with basic mesh these plumes cannot be seen , only smaller bubbles form and coalesce in no time in to large bubbles and collapses with out creating much turbulance is observed.
4)After mesh reinement plume and spikes are clearly observed and higher turbulance is created and whirls are formed.
Steady state approach is not suitabe for this type of problems as solution is time dependent and it changes with respect to time .In the linear phase, the fluid movement can be closely approximated by linear equations and the amplitude of perturbations is growing exponentially with time. In the non-linear phase, perturbation amplitude is too large for a linear approximation, and non-linear equations are required to describe fluid motions. In general, the density disparity between the fluids determines the structure of the subsequent non-linear RT instability flows (assuming other variables such as surface tension and viscosity are negligible here).
Atwood number:
The difference in the fluid densities divided by their sum is defined as the Atwood number A . For A close to 0, RT instability flows take the form of symmetric "fingers" of fluid; for A close to 1, the much lighter fluid "below" the heavier fluid takes the form of larger bubble-like plumes.
A for Case 1 and 2:
`A1=(rho_(water)-rho_(air))/(rho_(water)+rho_(air))`
A1=0.9975;
`A2=(rho_(water)-rho_(user def))/(rho_(water)+rho_(user def))`
A2=0.4278
Effect of Atwood number :As mentioned in the definition , if A is close to 1 then instability flows take the form of 'bubbles' as in the case 1 and 2 where A is almost eqaul to 1 and if A is close to 0 'finger' like shapes are observed as in the case three where A is 0.42 and instabiity takes more time to develop at the interface than case 1 and 2.