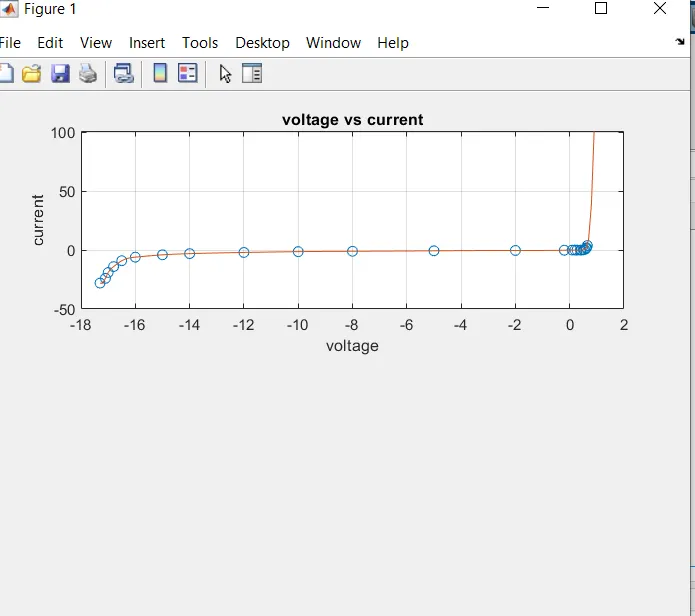
Project - Data Handling and Interpolation
Project :
In a laboratory experiment, data of voltage and current has been recorded and the same is attached in an excel file ( VI.xlsx ). Read the excel file in the Matlab program and perform the interpolation in the range of -17.3:0.1:0.9. Generate the interactive plot for the interpolated data. Additionally, compute the current values for given voltages below and store them in a text file.
VV =[-17.2 -17.1 -13.8 -13.5 -13.0 -12.5 -11 -9 -5.76 -6 -1 0.11 0.25 0.5 0.61]’
Ans:
Coding:
file =
-17.3000 -28.0000
-17.1000 -24.0000
-17.0000 -19.0000
-16.8000 -14.0000
-16.5000 -9.0000
-16.0000 -6.0000
-15.0000 -4.0000
-14.0000 -3.0000
-12.0000 -2.0000
-10.0000 -1.3000
-8.0000 -1.0000
-5.0000 -0.6000
-2.0000 -0.3000
-0.2000 -0.1000
0.0900 0
0.1900 0
0.2700 0
0.3900 0.0100
0.4300 0.0300
0.5000 0.1700
0.5500 0.4200
0.6000 1.2300
0.6200 1.9900
0.6500 3.9100
Waveforms: