Project - Data Handling and Interpolation
clc %%to clear screen
clear all %%to clear workspace
[data]=xlsread('MATLAB_PROJECT.xlsx'); %%to read excel file
x=data(:,1); %%to access voltage data
v=data(:,2); %%to access current data
xq=-17.3:0.1:0.9; %%to asign query points
figure(1) %%to depicts figure
vq1=interp1(x,v,xq); %%to interpolation
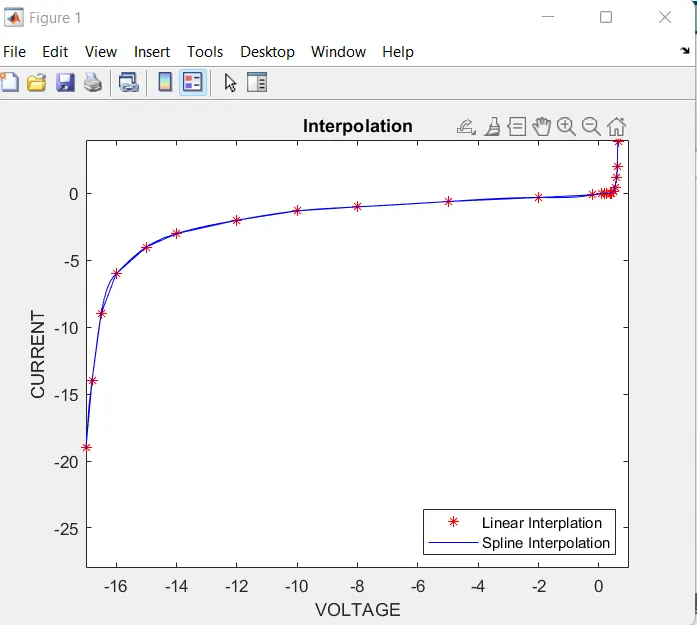
plot(x,v,'*r',xq,vq1,'-b'); %%to plot the interpolation
ylim([-28 4]); %%limit of y
xlim([-17 1]); %%limit of x
grid %%grid of plot
title('Interpolation'); %%title
hold on %%to hold the plot
vq2 = interp1(x,v,xq,'spline'); %%to spline interpolation
plot(x,v,'*r',xq,vq2,'-b'); %%to plot the interpolation
ylim([-28 4]); %%limit of y
xlim([-17 1]); %%limit of x
grid %%grid of plot
xlabel('VOLTAGE'); %%labelling of x
ylabel('CURRENT'); %%labelling of y
legend({'Linear Interplation','Spline Interpolation'},'location','southeast'); %%to show variation of plot
fileID=fopen('projecttext.txt','w'); %%command for written in text file
fprintf(fileID,'%f \t','vq1','vq2'); %%to print interpolation in text file
fclose(fileID); %%to closed the file
OUTPUT:-