Project - Data Handling and Interpolation
Matlab Program for Project : Data Hnadling & Interpolation:
%reading given file VI.xlsx using read function
fileID=readmatrix('VI.xlsx');
%loading V & I from VI.xlsx file
V=fileID(:,1);
I=fileID(:,2);
%given values for the interpolation
X=-17.3:0.1:0.9;
%Spline interpolation
Y=interp1(V,I,X,'spline');
%Linear interpolation
Y1=interp1(V,I,X);
%Assigning Z-Matrix to save interpolated values
Z=[X ; Y];
%plotting for Splinal interpolation and assigning as figure(1)
figure(1);
plot(V,I,'og',X,Y,'m');grid on;
%providing x & y-axis labels to the figure(1)
xlabel('VOLTAGE(V)');
ylabel('CURRENT(I)');
%providing title to the figure(1)
title('SPLINE INTERPOLATION');
%Using legend to provide clear identification for actual & interpolated values
legend('Actual value','Interpolated value','Location','northeast');
%saving plotted graph for our reference
saveas(figure(1),'Spline interpolation.pdf')
%plotting for Splinal interpolation and assigning as figure(2)
figure(2)
plot(V,I,'or',X,Y1,'c');grid on;
%providing x & y-axis labels to the figure(2)
xlabel('VOLTAGE(V)');
ylabel('CURRENT(I)');
%providing title to the figure(2)
title('LINEAR INTERPOLATION');
%Using legend to provide clear identification for actual & interpolated values
legend('Actual value','Interpolated value','Location','northeast');
%saving plotted graph for our reference
saveas(figure(2),'Linear Interpolation.pdf')
%Storing Spline Interpolated values in .txt file
%open .txt file
file=fopen('interpolated.txt','w');
%load the values using fprintf function
fprintf(file,'%s %s %s \n',' VOLTAGE ',' CURRENT','[SPLINE INTERPOLATION]');
fprintf(file,'\n %f %f \n',Z);
%close the open file
fclose(file);
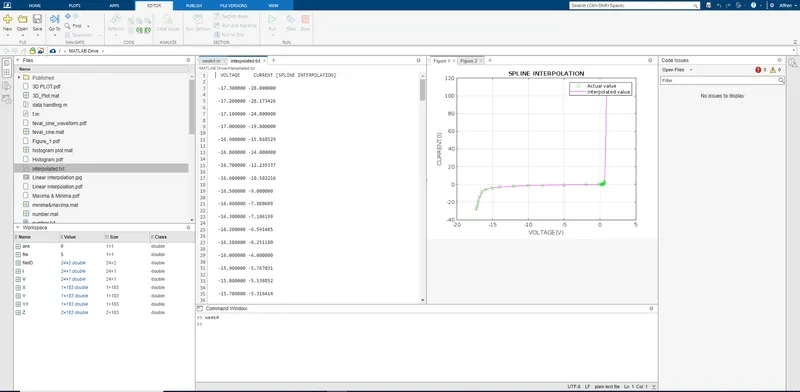
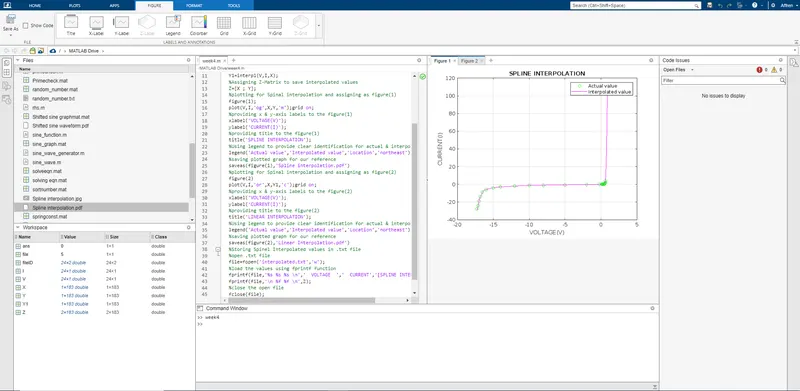
- Figure(1)-Spinal Interpolation (Attached pdf also)
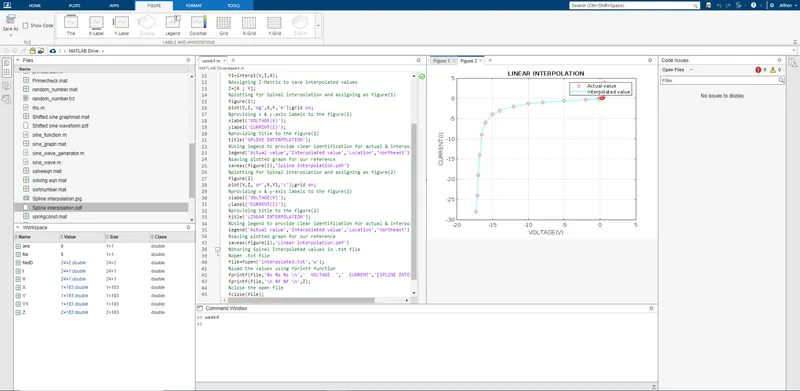
- Figure(2)-Linear Interpolation (Attached pdf also)
- Loading interpolated values in interpolation.txt file (Attached .txt fiel also)