Project - Data Handling and Interpolation
1:In this project, we are reading the excel file into the MATLAB program.
2:perform the interpolation in the range of -17.3:0.1:0.9
3:Generating the interactive plot for the interpolated data and store them in a text file.
M-script:
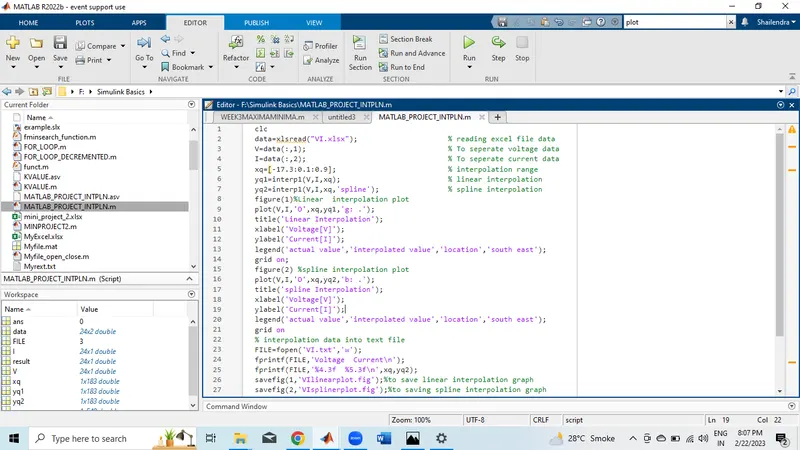
clc
data=xlsread("VI.xlsx"); % reading excel file data
V=data(:,1); % To seperate voltage data
I=data(:,2); % To seperate current data
xq=[-17.3:0.1:0.9]; % interpolation range
yq1=interp1(V,I,xq); % linear interpolation
yq2=interp1(V,I,xq,'spline'); % spline interpolation
figure(1) %Linear interpolation plot
plot(V,I,'O',xq,yq1,'g: .');
title('Linear Interpolation');
xlabel('Voltage[V]');
ylabel('Current[I]');
legend('actual value','interpolated value','location','south east');
grid on;
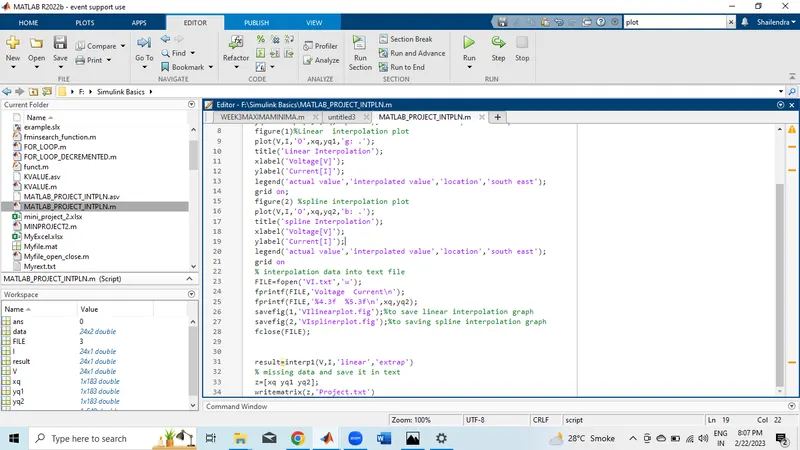
figure(2) %spline interpolation plot
plot(V,I,'O',xq,yq2,'b: .');
title('spline Interpolation');
xlabel('Voltage[V]');
ylabel('Current[I]');
legend('actual value','interpolated value','location','south east');
grid on
% interpolation data into text file
FILE=fopen('VI.txt','w');
fprintf(FILE,'Voltage Current\n');
fprintf(FILE,'%4.3f %5.3f\n',xq,yq2);
savefig(1,'VIlinearplot.fig'); %to save linear interpolation graph
savefig(2,'VIsplinerplot.fig'); %to saving spline interpolation graph
fclose(FILE);
result=interp1(V,I,'linear','extrap')
% to find missing data and save it in text
z=[xq yq1 yq2];
writematrix(z,'Project.txt')
MATLAB_PROJECT_INTPLN
result =
-23.1000
-22.3000
-21.3000
-20.3000
-19.3000
-18.7000
-18.3000
-18.1000
-17.9000
-17.7600
-17.7000
-17.6200
-17.5600
-17.5200
-17.5000
-17.5000
-17.5000
-17.4980
-17.4940
-17.4660
-17.4160
-17.2540
-17.1020
-16.8180
Interpolation is a method of fitting the data points to represent the value of a function. It has various applications in engineering and science, that are used to construct new data points within provided range of a discrete data set of known data points.
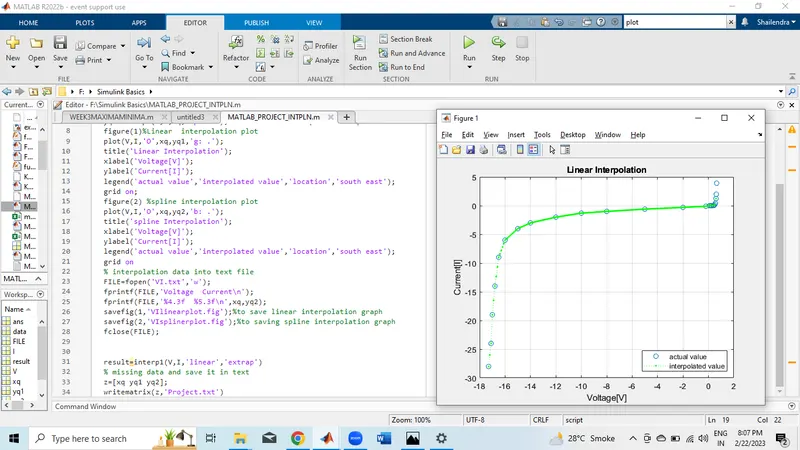
A: LINEAR INTERPOLATION
A linear interpolation is a form of interpolation, which involves the generation of new values based on an existing set of values.
B: SPLINE INTERPOLATION
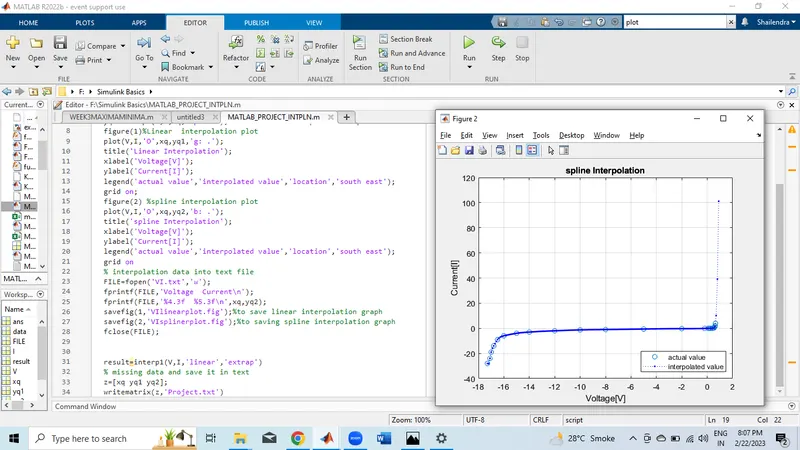
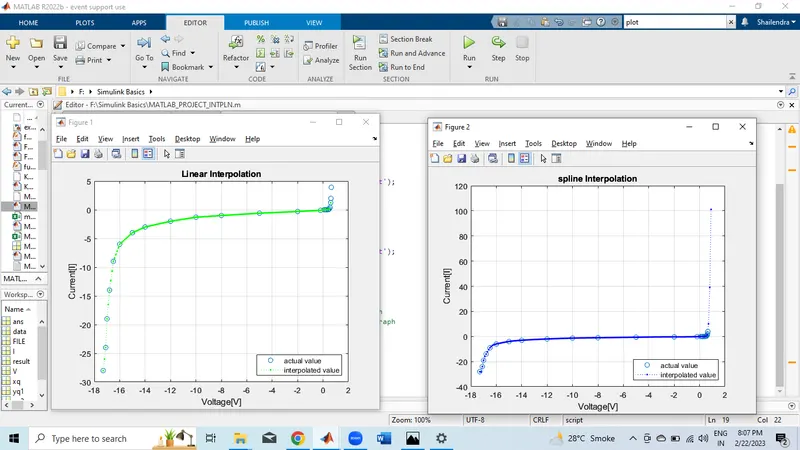
By using given data(voltage and current ) and performed linear interpolation and spline interpolation which can be seen in genearted waveform.