Project - Data Handling and Interpolation
% Data handling & Interpolation
%%
vi = xlsread('VI.xlsx'); % Importing data from Excel sheet.
v = vi(:,1); % Extracting the voltage data from Excel.
i = vi(:,2); % Extracting the Current data from Excel.
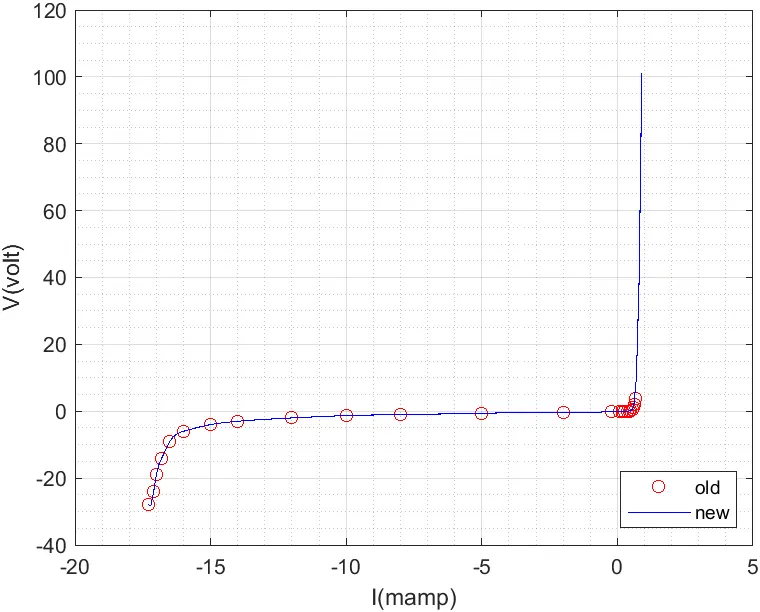
plot(v,i,'ro'); hold on; % plotting graph between v&i using given data & holding.
grid on; grid minor; % showing grid.
xlabel('I(mamp)'); % Labeling X-axis.
ylabel('V(volt)'); % Labeling Y-axis.
%%
vii = -17.3:0.1:0.9; % Interpolation voltage range.
iiv = spline(v,i,vii); % Calculating the current values using given data for above voltage range.
A =[vii;iiv]; % New data of voltage and current.
plot(vii,iiv,'b'); % plotting graph with new data.
legend ({'old','new'},'location','southeast'); % Naming to the graph & positioning.
%%
vv = xlsread('VI.xlsx',2); % Extracting the voltage data from second sheet of Excel.
% vv = [-17.2 -17.1 -13.8 -13.5 -13.0 -12.5 -11 -9 -5.76 -6 -1,....
% 0.11 0.25 0.5 .61];
ii = spline(v,i,vv); % Interpolation of current values for the given voltage.
intp = [vv ii]; % given voltage & interpolated current values.
%%
f = fopen('interpolation.txt','w'); % writing the text file of the interpoation data.
fprintf(f,'%.3f %.3f\n',[vv; ii]); % printing the data to the text file with 3decimal points.
fclose(f); % closing the file.
%%
n = fopen('int_data.txt','w'); % writing the text file of the interpoation data.
fprintf(n,'%2f %2f\n',[vii;iiv]); % printing the data to the text file.
fclose(n); % closing the file.