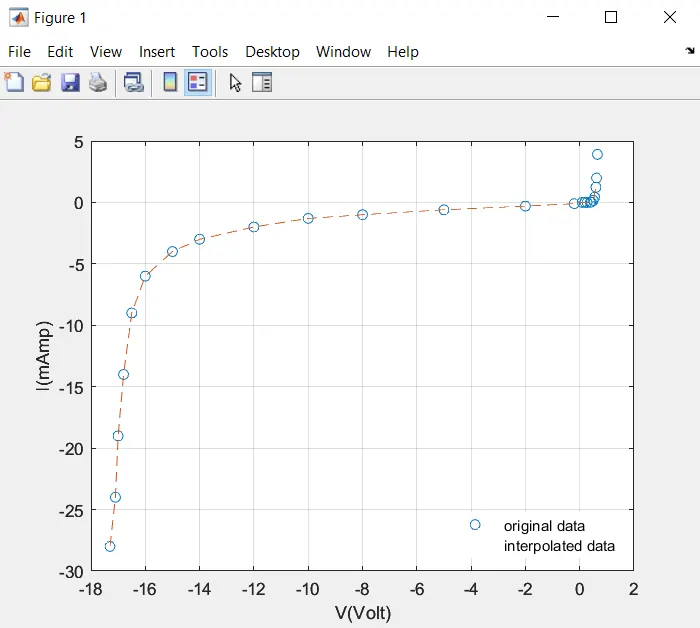
Project - Data Handling and Interpolation
- Read the data from the Excel using 'readtable' command with '.xlsx'
- Load voltage values in V and current values in I.
- Load interpolation range in 'xq'.
- Using 'interp1' command we can achieve 2-D interpolation for V, I and xq and save them in interp.
- Plot V and I values and hold the plot, again plot the interpolation range to interpolation values on the same plot.
- Lable X-axis as Voltage and Y-axis as Current and provide legends, by using 'Location' command we can position the legend box anywhere on a plot.
- Use 'dlmwrite' to save the interpolated data in a text file.
>> data = readtable("VI.xlsx");
>> V = data.V_Volt;
>> I = data.I_mAmp;
>> xq = -17.3:0.1:0.9;
>> interp = interp1(V, I, xq);
>> plot(V,I,'o');grid;hold;
Current plot held
>> plot(xq,interp, '--');
>> xlabel('V(Volt)');ylabel('I(mAmp)');
>> legend('original data','interpolated data','Location','southeast');
>> dlmwrite('interpolated_data.txt',[xq, interp]);