Project - Data Handling and Interpolation
Aim:
To make the MATLAB program for interpolation data analysing
Objective:
In a laboratory experiment, data of voltage and current has been recorded and the same is attached in perform the interpolation in the range of -17.3:0.1:0.9. Generate the interactive plot for the interpolated data and store them file.
Matlab program:
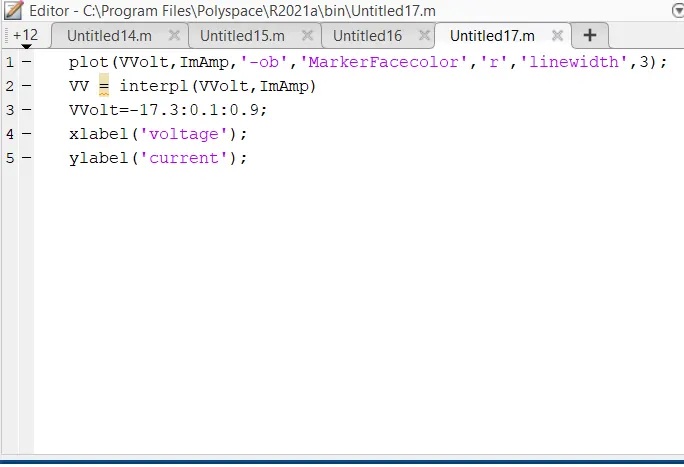
plot(V Volt,I Amp,'-ob','MarkerFacecolor','r','linewidth',3);
VV = interpl(VVolt,ImAmp)
VVolt=-17.3:0.1:0.9;
xlabel('voltage');
ylabel('current');
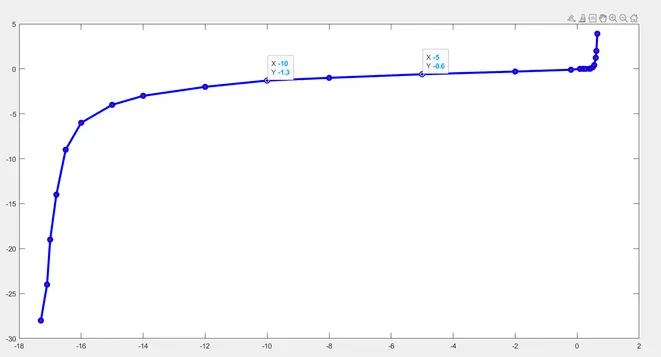
Output:
A =
- -17.3000 -28.0000
-17.1000 -24.0000
-17.0000 -19.0000
-16.8000 -14.0000
-16.5000 -9.0000
-16.0000 -6.0000
-15.0000 -4.0000
-14.0000 -3.0000
-12.0000 -2.0000
-10.0000 -1.3000
-8.0000 -1.0000
-5.0000 -0.6000
-2.0000 -0.3000
-0.2000 -0.1000
0.0900 0
0.1900 0
0.2700 0
0.3900 0.0100
0.4300 0.0300
0.5000 0.1700
0.5500 0.4200
0.6000 1.2300
0.6200 1.9900
0.6500 3.9100
Interpolation data using :
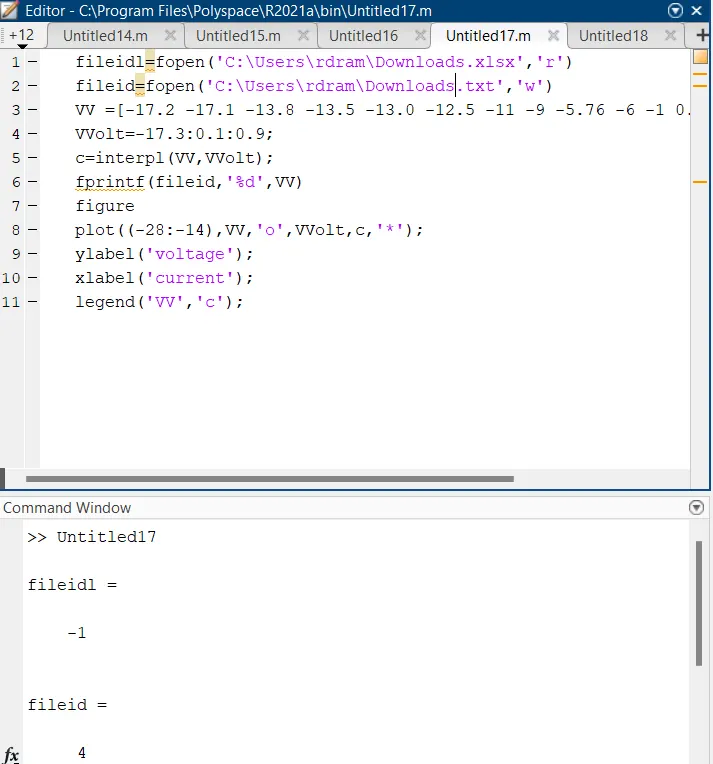
fileidl=fopen('C:\Users\rdram\Downloads.xlsx','r')
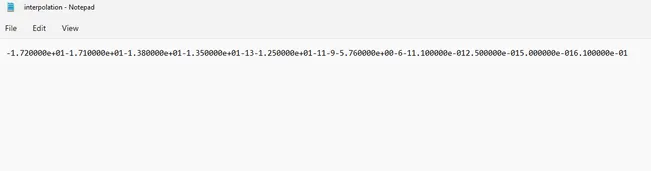
fileid=fopen('C:\Users\rdram\Downloads.txt','w')
VV =[-17.2 -17.1 -13.8 -13.5 -13.0 -12.5 -11 -9 -5.76 -6 -1 0.11 0.25 0.5 0.61];
VVolt=-17.3:0.1:0.9;
c=interpl(VV,VVolt);
fprintf(fileid,'%d',VV)
figure
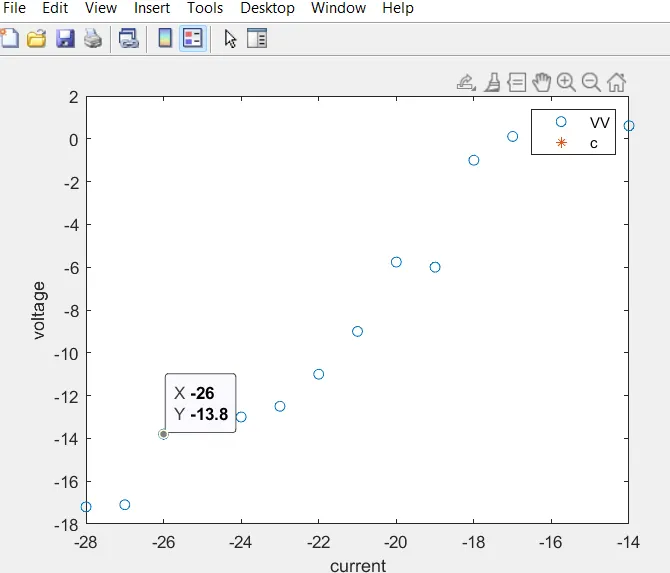
plot((-28:-14),VV,'o',VVolt,c,'*');
ylabel('voltage');
xlabel('current');
legend('VV','c');
Output:
Conclusion:
The interpolation model using xlc doc data will be verifyed succesfully