Project - Data Handling and Interpolation
PROJECT
Aim:In a laboratory experiment, data of voltage and current has been recorded and the same is attached in an excel file ( Click on this link VI.xlsx ). Read the excel file in the Matlab program and perform the interpolation in the range of -17.3:0.1:0.9. Generate the interactive plot for the interpolated data and store them in a text file.
Objective:
- Read excel file
- Interpolate the data set
- Find missing data and save it in text
Program:
clc;                     %clear commnd window
clear all;               %clear workspace
D=xlsread("VI.xlsx");    %read excel file
V=D(:,1);                %taking values of V from first column of D
I=D(:,2);                %taking values of I from second column of D
V_int = -17.3:0.1:0.9;   %giving interpolation range for voltage
I_int=interp1(V,I,V_int,'spline'); %finding values of I using interpolation
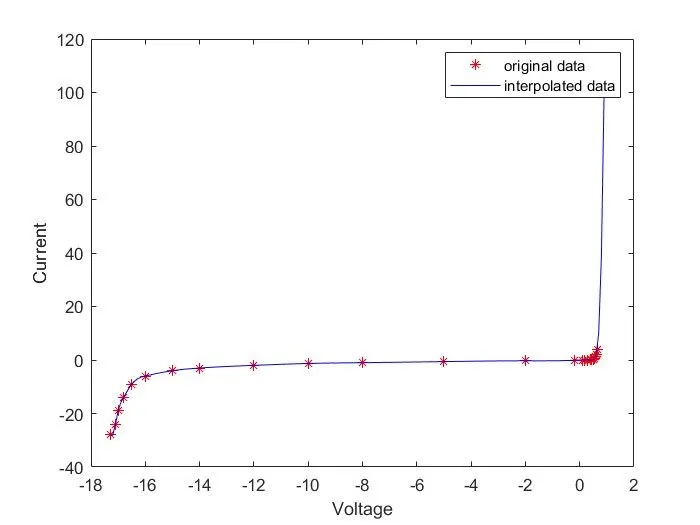
plot(V,I,'r*');          %plotting values of V and I given in excel
hold on
plot(V_int,I_int,'b')    %plotting V and I after interpolation
legend('original data','interpolated data');
xlabel('Voltage');ylabel('Current');
hold off
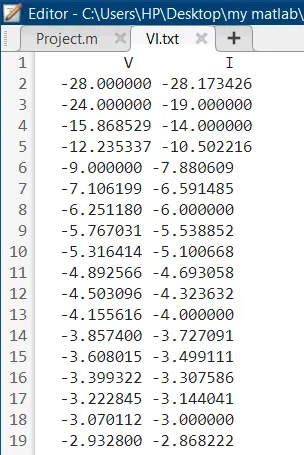
fileID = fopen('VI.txt','w');   %writing data to text file
fprintf(fileID,'%8s %10s \n','V', 'I');
fprintf( fileID, '%f %f  \n',I_int);
fclose(fileID);
Result:
- Read the excel file
- Interpolated data and found the missing data
- Plotted the original data and interpolated data as shown below
- Saved the interpolated data in the text file