Project - Data Handling and Interpolation
Answer:
Voltage and current data is given.
Range is given as -17.3:0.1:0.9
Program-
data=xlsread("VI.xlsx");
V=data(:,1);
I=data(:,2);
V1=-17.3:0.1:0.9;
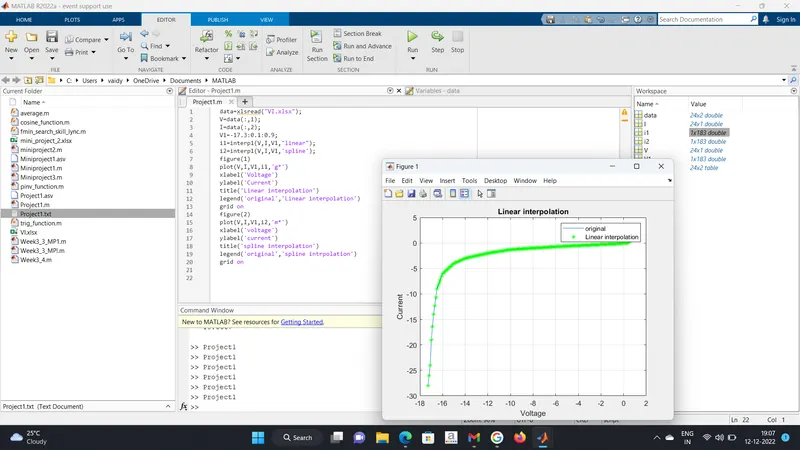
i1=interp1(V,I,V1,"linear");
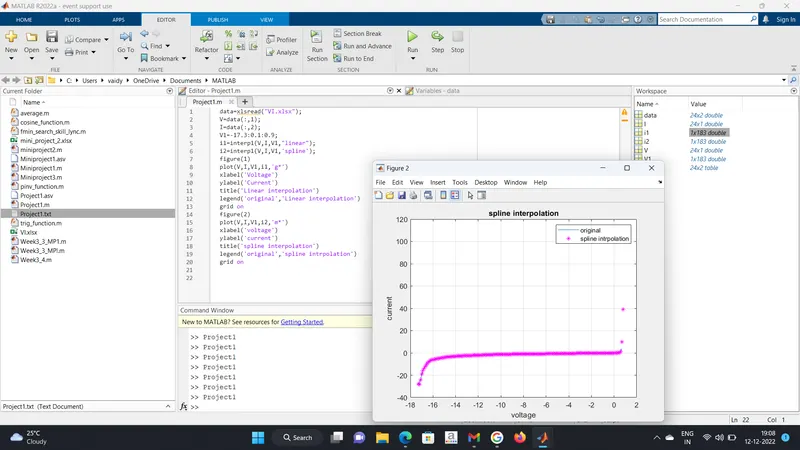
i2=interp1(V,I,V1,'spline');
figure(1)
plot(V,I,V1,i1,'g*')
xlabel('Voltage')
ylabel('Current')
title('Linear interpolation')
legend('original','Linear interpolation')
grid on
figure(2)
plot(V,I,V1,i2,'m*')
xlabel('voltage')
ylabel('current')
title('spline interpolation')
legend('original','spline intrpolation')
grid on
Linear Interploation:
Spline Intrpolation:
- Text file (Project1.txt) & .m file (Project1.m) attached herewith for reference please.