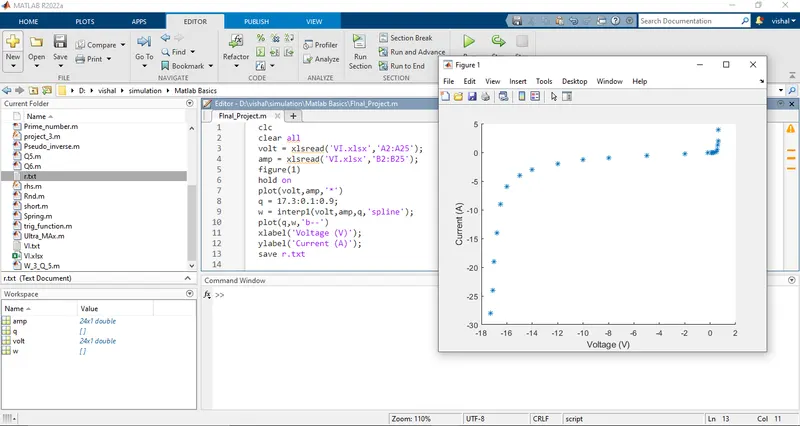
Project - Data Handling and Interpolation
Q)
clc
clear all
volt = xlsread('VI.xlsx','A2:A25');
amp = xlsread('VI.xlsx','B2:B25');
figure(1)
hold on
plot(volt,amp,'*')
q = 17.3:0.1:0.9;
w = interp1(volt,amp,q,'spline');
plot(q,w,'b--')
xlabel('Voltage (V)');
ylabel('Current (A)');
save r.txt