Project - Data Handling and Interpolation
Project-
Data handling and Interpolation:
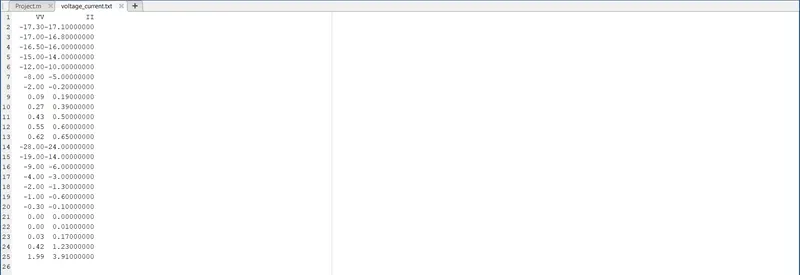
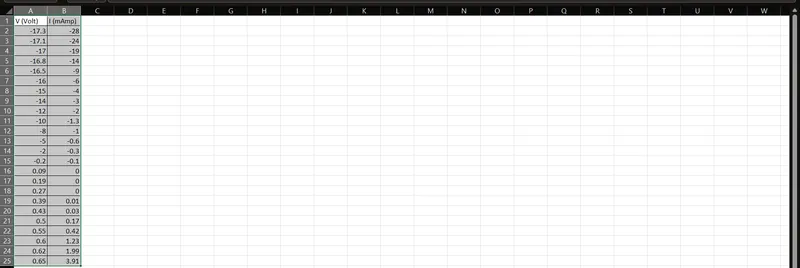
To find:In a laboratory experiment, data of voltage and current has been recorded and the same is attached in an excel file . Read the excel file in the Matlab program and perform the interpolation in the range of -17.3:0.1:0.9. Generate the interactive plot for the interpolated data and store them in a text file.
Aim :
- Find missing data and save it in text
- Interpolate the data set
- Save your program and attach the same.
- Save txt file and upload in attachment
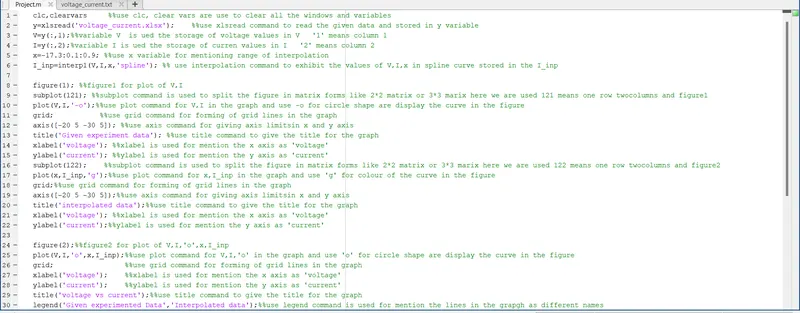
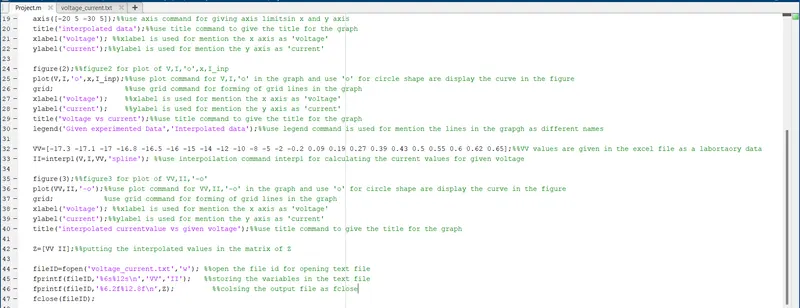
%%code of Data handling and interpolation
clc,clearvars %%use clc, clear vars are use to clear all the windows and variables
y=xlsread('voltage_current.xlsx'); %%use xlsread command to read the given data and stored in y variable
V=y(:,1);%%variable V is ued the storage of voltage values in V '1' means column 1
I=y(:,2);%variable I is ued the storage of curren values in I '2' means column 2
x=-17.3:0.1:0.9; %%use x variable for mentioning range of interpolation
I_inp=interp1(V,I,x,'spline'); %% use interpolation command to exhibit the values of V,I,x in spline curve stored in the I_inp
figure(1); %%figure1 for plot of V,I
subplot(121); %%subplot command is used to split the figure in matrix forms like 2*2 matrix or 3*3 marix here we are used 121 means one row twocolumns and figure1
plot(V,I,'-o');%%use plot command for V,I in the graph and use -o for circle shape are display the curve in the figure
grid; %%use grid command for forming of grid lines in the graph
axis([-20 5 -30 5]); %%use axis command for giving axis limitsin x and y axis
title('Given experiment data'); %%use title command to give the title for the graph
xlabel('voltage'); %%xlabel is used for mention the x axis as 'voltage'
ylabel('current'); %%ylabel is used for mention the y axis as 'current'
subplot(122); %%subplot command is used to split the figure in matrix forms like 2*2 matrix or 3*3 marix here we are used 122 means one row twocolumns and figure2
plot(x,I_inp,'g');%%use plot command for x,I_inp in the graph and use 'g' for colour of the curve in the figure
grid;%%use grid command for forming of grid lines in the graph
axis([-20 5 -30 5]);%%use axis command for giving axis limitsin x and y axis
title('interpolated data');%%use title command to give the title for the graph
xlabel('voltage'); %%xlabel is used for mention the x axis as 'voltage'
ylabel('current');%%ylabel is used for mention the y axis as 'current'
figure(2);%%figure2 for plot of V,I,'o',x,I_inp
plot(V,I,'o',x,I_inp);%%use plot command for V,I,'o' in the graph and use 'o' for circle shape are display the curve in the figure
grid; %%use grid command for forming of grid lines in the graph
xlabel('voltage'); %%xlabel is used for mention the x axis as 'voltage'
ylabel('current'); %%ylabel is used for mention the y axis as 'current'
title('voltage vs current');%%use title command to give the title for the graph
legend('Given experimented Data','Interpolated data');%%use legend command is used for mention the lines in the grapgh as different names
VV=[-17.3 -17.1 -17 -16.8 -16.5 -16 -15 -14 -12 -10 -8 -5 -2 -0.2 0.09 0.19 0.27 0.39 0.43 0.5 0.55 0.6 0.62 0.65];%%VV values are given in the excel file as a labortaory data
II=interp1(V,I,VV,'spline'); %%use interpoilation command interp1 for calculating the current values for given voltage
figure(3);%%figure3 for plot of VV,II,'-o'
plot(VV,II,'-o');%%use plot command for VV,II,'-o' in the graph and use 'o' for circle shape are display the curve in the figure
grid; %use grid command for forming of grid lines in the graph
xlabel('voltage'); %%xlabel is used for mention the x axis as 'voltage'
ylabel('current');%%ylabel is used for mention the y axis as 'current'
title('interpolated currentvalue vs given voltage');%%use title command to give the title for the graph
Z=[VV II];%%putting the interpolated values in the matrix of Z
fileID=fopen('voltage_current.txt','w'); %%open the file id for opening text file
fprintf(fileID,'%6s%12s\n','VV','II'); %%storing the variables in the text file
fprintf(fileID,'%6.2f%12.8f\n',Z); %%colsing the output file as fclose
fclose(fileID);
%%Data for onterpolation of laboratory values of voltage and current in excel sheet image
%%code images are
%%command window values

figure:(1)
figure(1); %%figure1 for plot of V,I
subplot(121); %%subplot command is used to split the figure in matrix forms like 2*2 matrix or 3*3 marix here we are used 121 means one row twocolumns and figure1
plot(V,I,'-o');%%use plot command for V,I in the graph and use -o for circle shape are display the curve in the figure
grid; %%use grid command for forming of grid lines in the graph
axis([-20 5 -30 5]); %%use axis command for giving axis limitsin x and y axis
title('Given experiment data'); %%use title command to give the title for the graph
xlabel('voltage'); %%xlabel is used for mention the x axis as 'voltage'
ylabel('current'); %%ylabel is used for mention the y axis as 'current'
subplot(122); %%subplot command is used to split the figure in matrix forms like 2*2 matrix or 3*3 marix here we are used 122 means one row twocolumns and figure2
plot(x,I_inp,'g');%%use plot command for x,I_inp in the graph and use 'g' for colour of the curve in the figure
grid;%%use grid command for forming of grid lines in the graph
axis([-20 5 -30 5]);%%use axis command for giving axis limitsin x and y axis
title('interpolated data');%%use title command to give the title for the graph
xlabel('voltage'); %%xlabel is used for mention the x axis as 'voltage'
ylabel('current');%%ylabel is used for mention the y axis as 'current'
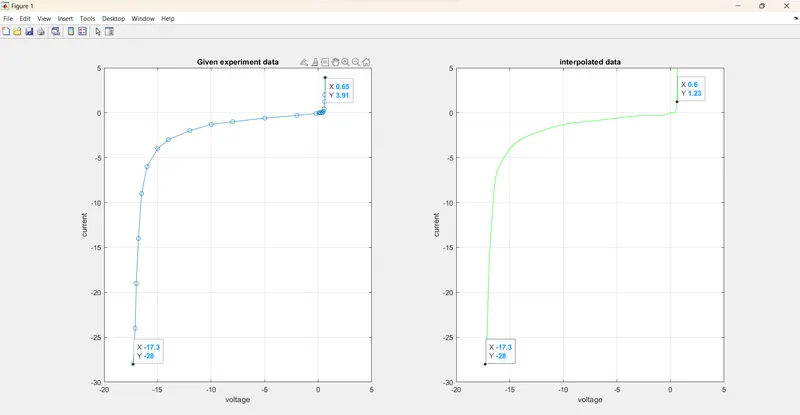
figure:(2)
figure(2);%%figure2 for plot of V,I,'o',x,I_inp
plot(V,I,'o',x,I_inp);%%use plot command for V,I,'o' in the graph and use 'o' for circle shape are display the curve in the figure
grid; %%use grid command for forming of grid lines in the graph
xlabel('voltage'); %%xlabel is used for mention the x axis as 'voltage'
ylabel('current'); %%ylabel is used for mention the y axis as 'current'
title('voltage vs current');%%use title command to give the title for the graph
legend('Given experimented Data','Interpolated data');%%use legend command is used for mention the lines in the grapgh as different names
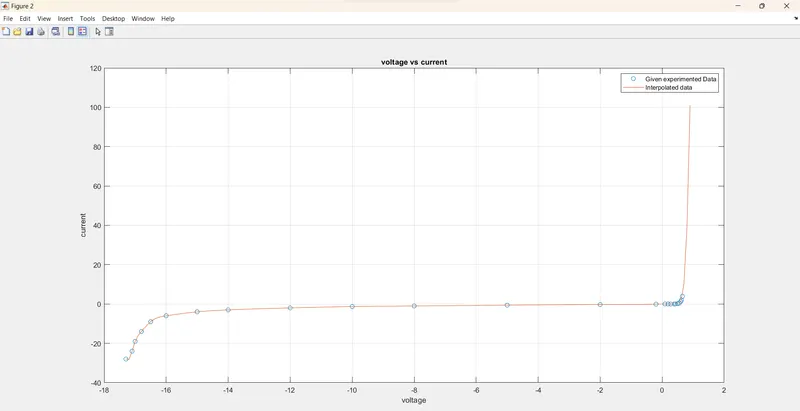
figure:(3)
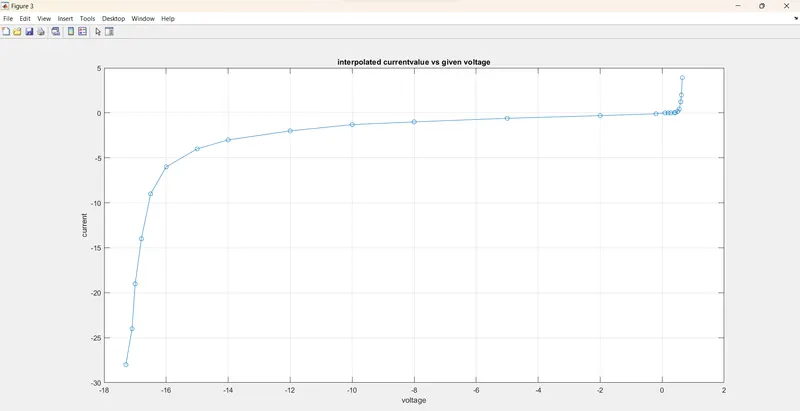
VV=[-17.3 -17.1 -17 -16.8 -16.5 -16 -15 -14 -12 -10 -8 -5 -2 -0.2 0.09 0.19 0.27 0.39 0.43 0.5 0.55 0.6 0.62 0.65];%%VV values are given in the excel file as a labortaory data
II=interp1(V,I,VV,'spline'); %%use interpoilation command interp1 for calculating the current values for given voltage
figure(3);%%figure3 for plot of VV,II,'-o'
plot(VV,II,'-o');%%use plot command for VV,II,'-o' in the graph and use 'o' for circle shape are display the curve in the figure
grid; %use grid command for forming of grid lines in the graph
xlabel('voltage'); %%xlabel is used for mention the x axis as 'voltage'
ylabel('current');%%ylabel is used for mention the y axis as 'current'
title('interpolated currentvalue vs given voltage');%%use title command to give the title for the graph
%%textfile