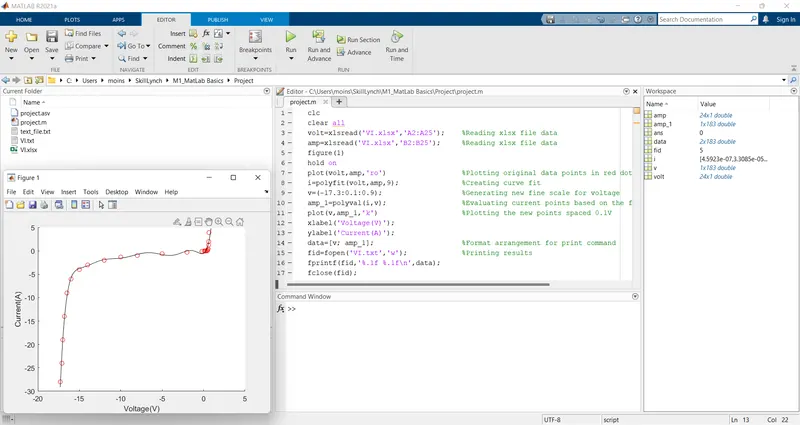
Project - Data Handling and Interpolation
clc
clear all
volt=xlsread('VI.xlsx','A2:A25');    %Reading xlsx file data
amp=xlsread('VI.xlsx','B2:B25');     %Reading xlsx file data
figure(1)
hold on
plot(volt,amp,'ro')                  %Plotting original data points in red dots
i=polyfit(volt,amp,9);               %Creating curve fit
v=(-17.3:0.1:0.9);                   %Generating new fine scale for voltage
amp_1=polyval(i,v);                  %Evaluating current points based on the fine scale of voltages
plot(v,amp_1,'k')                    %Plotting the new points spaced 0.1V
xlabel('Voltage(V)');
ylabel('Current(A)');
data=[v; amp_1];                     %Format arrangement for print command
fid=fopen('VI.txt','w');             %Printing results
fprintf(fid,'%.1f %.1f\n',data);
fclose(fid);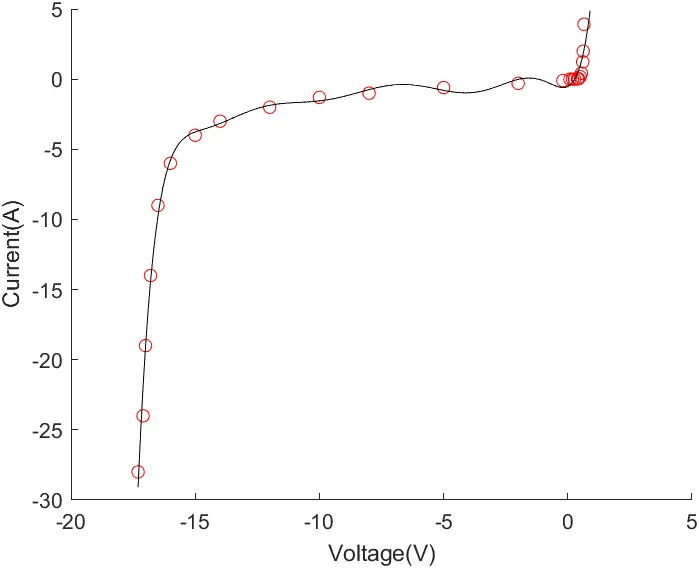
plot obtained by interpolation.
Hover the mouse cursor over the graph to view individual point coordinates.