Project - Data Handling and Interpolation
PROJECT 1:
clc;
A=xlsread('Vi.xlsx');   % xlsread Read Microsoft Excel spreadsheet file.
V=A(:,1);               %taking 1st column values from xlsheet 1.
I=A(:,2);               %taking 2nd column values from xlsheet 1.
plot(V,I)                                   %plot(voltage,current).
X=-17.3:0.1:0.9;
Y=interp1(V,I,X,'spline');  %interp1 1-D interpolation using spline Cubic spline data interpolation.
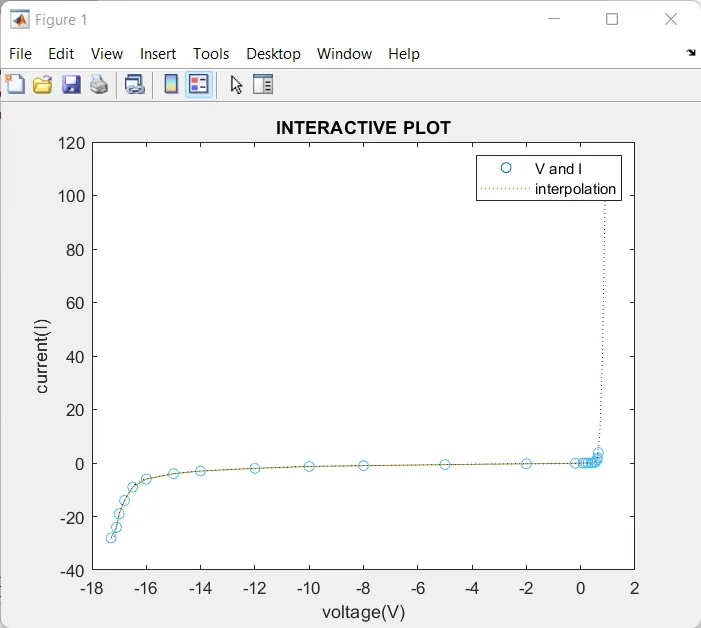
plot(V,I,'o',X,Y,':');                      %plot(V,I,'o',X,Y,':')
hold on
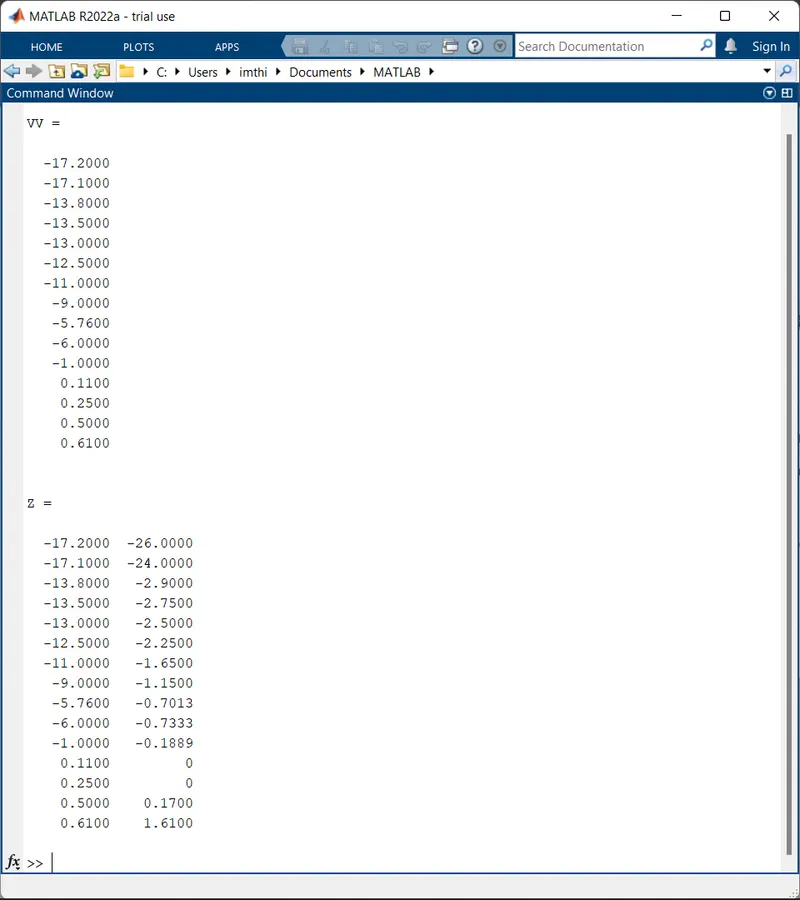
VV =[-17.2;-17.1;-13.8;-13.5;-13.0;-12.5;-11;-9;-5.76;-6;-1;0.11;0.25;0.5;0.61]
UU=interp1(V,I,VV);  %using interp1 1-D interpolation on (V,I,VV)
Z=[VV UU]
% plot(VV,UU,'*')
fid=fopen('project2.txt','w');  %using file pointer to open a new text file.
fprintf(fid,'%6s %12s\n','VV','UU');
fprintf(fid,'%6.2f %12.2f\n',Z);            %storing the Z values in text file.
fclose(fid);                                %closing the current project.
title('INTERACTIVE PLOT');                  %title of plot
xlabel('voltage(V)');ylabel('current(I)');  %labeling the plot.
legend('V and I','interpolation');