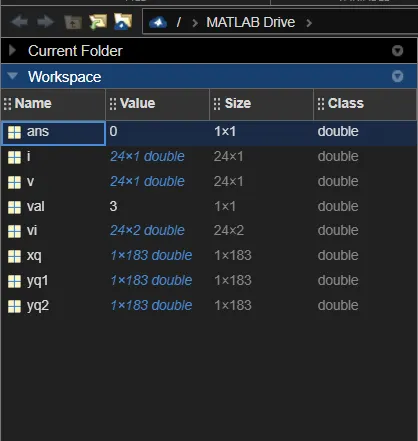
vi = readmatrix("VI.xlsx"); % readmatrix command is used to read the excel file VI
v = vi(:,1); % column 1 of matrix VI that contaions voltage values is sepearted and saved to vector v
i = vi(:,2); % column 2 of matrix VI that contaions current values is sepearted and saved to vector i
xq = -17.3:0.1:0.9; % Interpolation range is set as given in problem
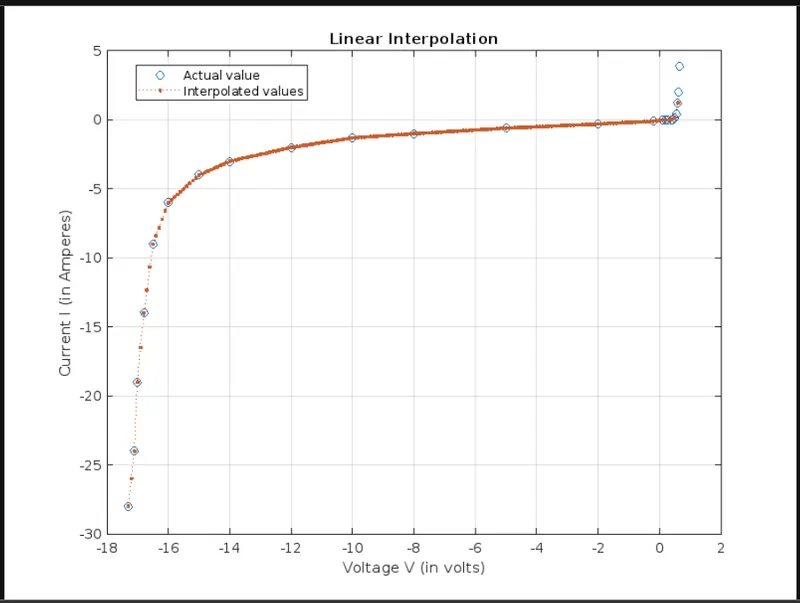
yq1 = interp1(v,i,xq); % interp1 is used for 1-d interpolation which is by default Linear interpolated values
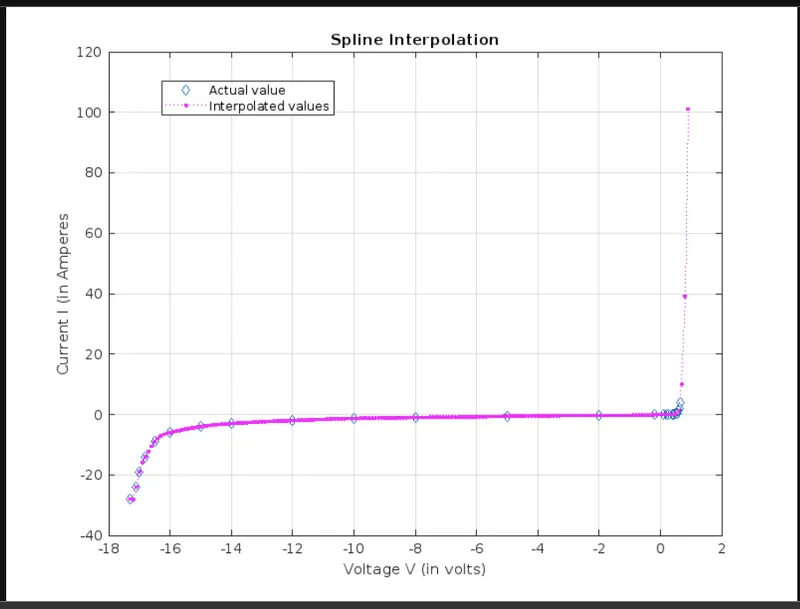
yq2 = interp1(v,i,xq,'spline'); % spline is specified in the interp1 to specifify the spline interpolated values
figure(1);
plot(v,i,'o',xq,yq1,':.'); % plotting Linear interpolated values over the given vi values
title('Linear Interpolation'); % title to the graph is provided using title function
xlabel('Voltage V (in volts)'); % label command is used to provide respective axis labels of the plot
ylabel('Current I (in Amperes)');
legend('Actual value','Interpolated values'); %legends are provided for actual and interpolated values
grid;
figure(2);
plot(v,i,'d',xq,yq2,'m:.'); % plotting Spline interpolated values over the given vi values
title('Spline Interpolation'); % title to the graph is provided using title function
xlabel('Voltage V (in volts)'); % label command is used to provide respective axis labels of the plot
ylabel('Current I (in Amperes');
legend('Actual value','Interpolated values'); %legends are provided for actual and interpolated values
grid;
val = fopen ("VI.txt",'w'); % opening txt file VI using fopen command
fprintf(val, 'Voltage Current\n'); % fprintf command is used to save the interpolated values to text file after spline interpolation is used
fprintf(val, '%f %f\n',xq,yq2); % fprintf command here inputs the voltage and current values
savefig(1,'VI-Linear.fig'); % savefig is used to store the linear interpolation graph as seperate file
savefig(2,'VI-Spline.fig'); % savefig is used to store the linear interpolation graph as seperate file
fclose(val); % val pointer is closed using fclose for VI txt file