Project - Data Handling and Interpolation
AIM:
Read the voltage and current values from the given excel file and interpolate the values between -17.3:0.1:0.9.
STEPS TO FOLLOW:
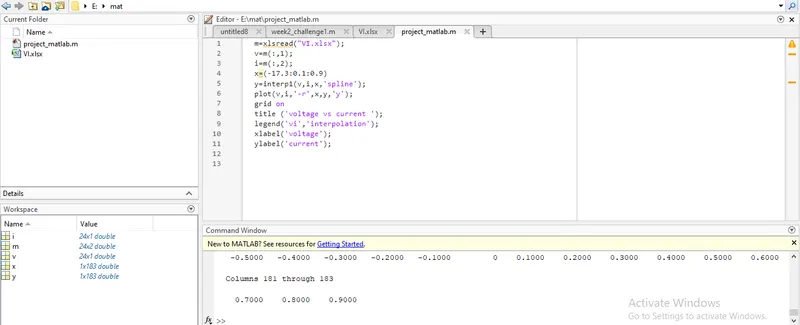
To read the excel file in the matlab using xlsread function by creating variable m.
Then to read the volatage v which isin coloumn 1 using v=m(:,1).
Then to read the current I which is in coloumn 2using i=m(m:,2).
Then to create interpolation as given in question(-17.3:0.1:0.9) using interpl function to obtain the data between -17.3 to 0.9 with the interval of 0.1.
Then plot the 2d graph of the interpolated values and the original values of voltage and current.
Then to display the grid,legend,x,y axis name,title using grid on,title,legend,xlabel,ylabel.
The below are the matlab code for
In the below graph shows the orginal values in the red colour and the interpolated values in the yellow colour
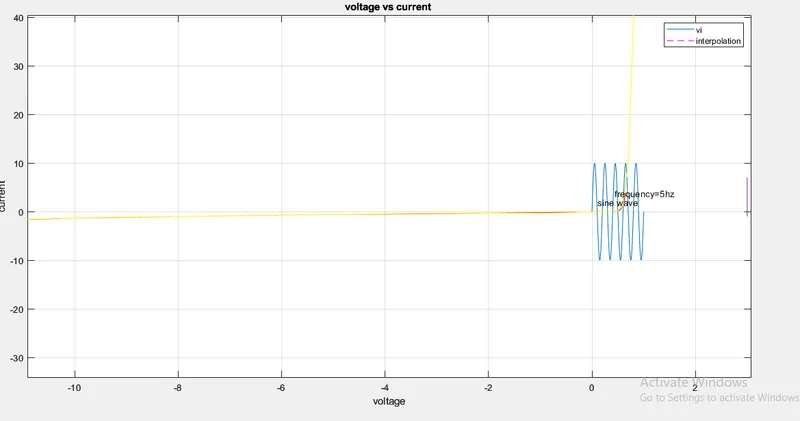
Result :
Finally the values are interpolated in the graph respectively.