Project - Data Handling and Interpolation
Code for interploation & savind it in text file:-
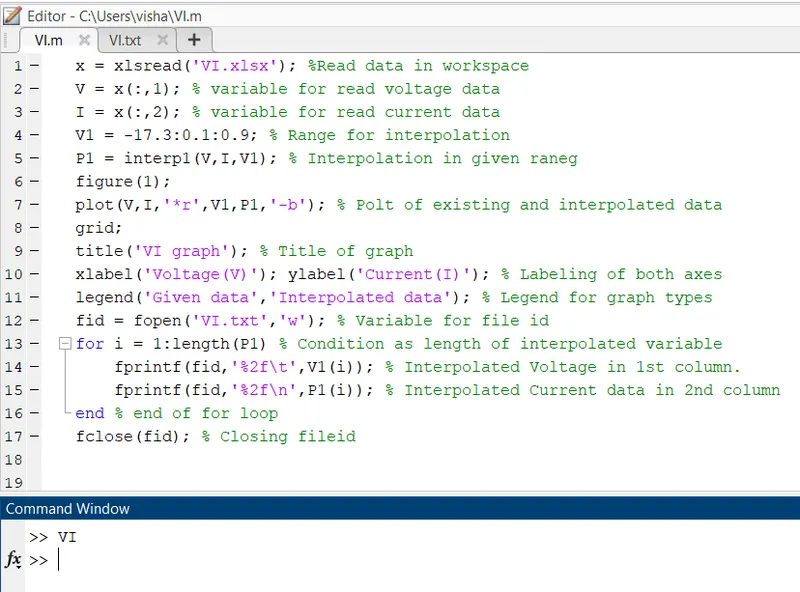
x = xlsread('VI.xlsx'); %Read data in workspace
V = x(:,1); % variable for read voltage data
I = x(:,2); % variable for read current data
V1 = -17.3:0.1:0.9; % Range for interpolation
P1 = interp1(V,I,V1); % Interpolation in given raneg
figure(1);
plot(V,I,'*r',V1,P1,'-b'); % Polt of existing and interpolated data
grid;
title('VI graph'); % Title of graph
xlabel('Voltage(V)'); ylabel('Current(I)'); % Labeling of both axes
legend('Given data','Interpolated data'); % Legend for graph types
fid = fopen('VI.txt','w'); % Variable for file id
for i = 1:length(P1) % Condition as length of interpolated variable
fprintf(fid,'%2f\t',V1(i)); % Interpolated Voltage in 1st column.
fprintf(fid,'%2f\n',P1(i)); % Interpolated Current data in 2nd column
end % end of for loop
fclose(fid); % Closing fileid
Screenshot :-
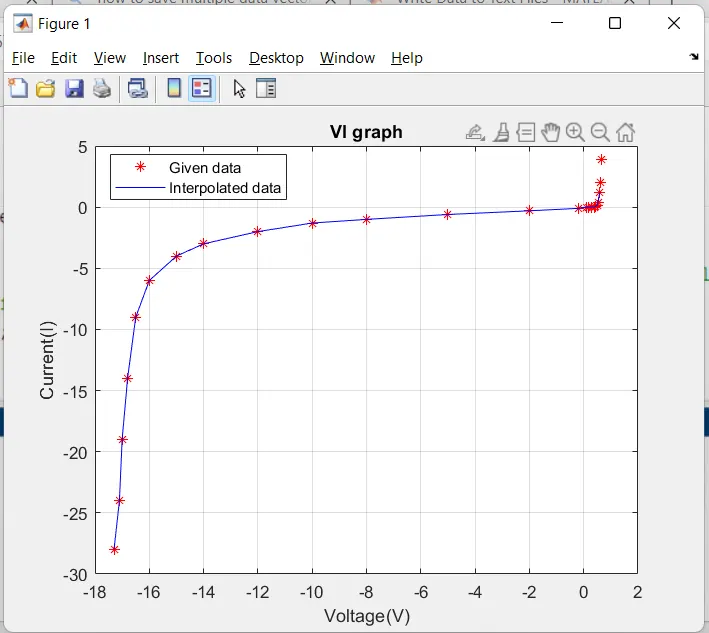
output graph :-
Intrpolated data saved in attached 'VI.txt' file.