Project - Data Handling and Interpolation
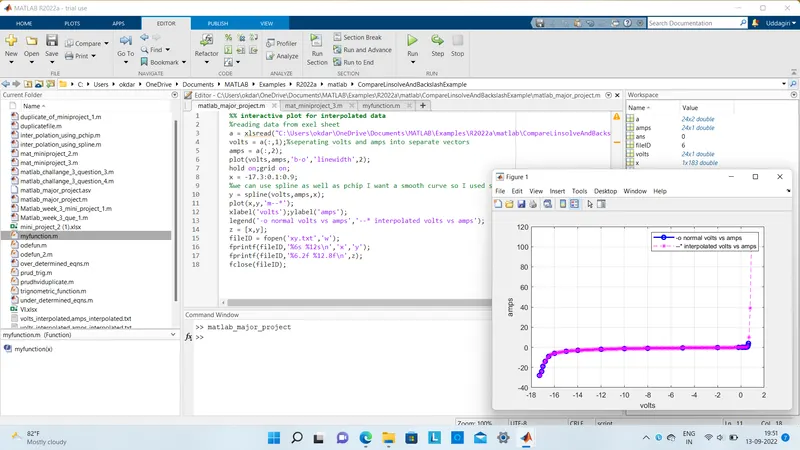
%% interactive plot for interpolated data
%reading data from exel sheet
a = xlsread("C:\Users\okdar\OneDrive\Documents\MATLAB\Examples\R2022a\matlab\CompareLinsolveAndBackslashExample\VI.xlsx");
volts = a(:,1);%seperating volts and amps into separate vectors
amps = a(:,2);
plot(volts,amps,'b-o','linewidth',2);
hold on;grid on;
x = -17.3:0.1:0.9;
%we can use spline as well as pchip I want a smooth curve so I used spline
y = spline(volts,amps,x);
plot(x,y,'m--*');
xlabel('volts');ylabel('amps');
legend('-o normal volts vs amps','--* interpolated volts vs amps');
z = [x,y];
fileID = fopen('xy.txt','w');
fprintf(fileID,'%6s %12s\n','x','y');
fprintf(fileID,'%6.2f %12.8f\n',z);
fclose(fileID);