Project - Data Handling and Interpolation
1.
Given range = -17.3:0.1:0.9
Step-1: Firstly save the given excel file with an extension of '.m'
Step-2: Import the data from the excel sheet to the workspace
>> abc
x =
Columns 1 through 10
-17.3000 -17.2000 -17.1000 -17.0000 -16.9000 -16.8000 -16.7000 -16.6000 -16.5000 -16.4000
Columns 11 through 20
-16.3000 -16.2000 -16.1000 -16.0000 -15.9000 -15.8000 -15.7000 -15.6000 -15.5000 -15.4000
Columns 21 through 30
-15.3000 -15.2000 -15.1000 -15.0000 -14.9000 -14.8000 -14.7000 -14.6000 -14.5000 -14.4000
Columns 31 through 40
-14.3000 -14.2000 -14.1000 -14.0000 -13.9000 -13.8000 -13.7000 -13.6000 -13.5000 -13.4000
Columns 41 through 50
-13.3000 -13.2000 -13.1000 -13.0000 -12.9000 -12.8000 -12.7000 -12.6000 -12.5000 -12.4000
Columns 51 through 60
-12.3000 -12.2000 -12.1000 -12.0000 -11.9000 -11.8000 -11.7000 -11.6000 -11.5000 -11.4000
Columns 61 through 70
-11.3000 -11.2000 -11.1000 -11.0000 -10.9000 -10.8000 -10.7000 -10.6000 -10.5000 -10.4000
Columns 71 through 80
-10.3000 -10.2000 -10.1000 -10.0000 -9.9000 -9.8000 -9.7000 -9.6000 -9.5000 -9.4000
Columns 81 through 90
-9.3000 -9.2000 -9.1000 -9.0000 -8.9000 -8.8000 -8.7000 -8.6000 -8.5000 -8.4000
Columns 91 through 100
-8.3000 -8.2000 -8.1000 -8.0000 -7.9000 -7.8000 -7.7000 -7.6000 -7.5000 -7.4000
Columns 101 through 110
-7.3000 -7.2000 -7.1000 -7.0000 -6.9000 -6.8000 -6.7000 -6.6000 -6.5000 -6.4000
Columns 111 through 120
-6.3000 -6.2000 -6.1000 -6.0000 -5.9000 -5.8000 -5.7000 -5.6000 -5.5000 -5.4000
Columns 121 through 130
-5.3000 -5.2000 -5.1000 -5.0000 -4.9000 -4.8000 -4.7000 -4.6000 -4.5000 -4.4000
Columns 131 through 140
-4.3000 -4.2000 -4.1000 -4.0000 -3.9000 -3.8000 -3.7000 -3.6000 -3.5000 -3.4000
Columns 141 through 150
-3.3000 -3.2000 -3.1000 -3.0000 -2.9000 -2.8000 -2.7000 -2.6000 -2.5000 -2.4000
Columns 151 through 160
-2.3000 -2.2000 -2.1000 -2.0000 -1.9000 -1.8000 -1.7000 -1.6000 -1.5000 -1.4000
Columns 161 through 170
-1.3000 -1.2000 -1.1000 -1.0000 -0.9000 -0.8000 -0.7000 -0.6000 -0.5000 -0.4000
Columns 171 through 180
-0.3000 -0.2000 -0.1000 0 0.1000 0.2000 0.3000 0.4000 0.5000 0.6000
Columns 181 through 183
0.7000 0.8000 0.9000
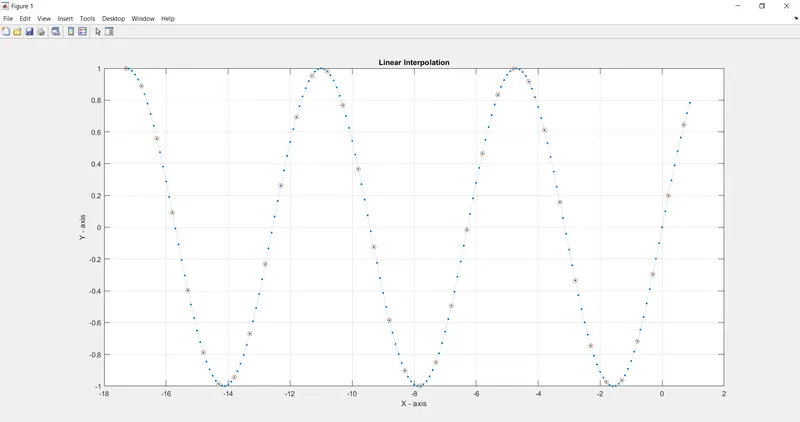
>> plot(x,v,':.',xq,vq1,'o') (% 'plot' command is used to draw the graph, 'o' is used to draw the circled line, ':.' command is used to draw the dotted line with pointed)
>> grid (% 'Grid' command is used to draw the grid lines on the graph sheet)
>> title ('Linear Interpolation') (% 'title' command is used to give a title to the graph on top)
>> xlabel('X - axis') (% 'xlabel' command is used to give the name to x-axis)
>> ylabel('Y - axis') (% 'ylabel' command is used to give the name to y-axis)