Project - Data Handling and Interpolation
Program:
%use xlsread command input from spreadsheet
data = xlsread('VI.xlsx');
%input data from spreadsheet first column in spreadsheet
v=data(:,1);
%input data from second column in spreadsheet
I=data(:,2);
plot(v,I,'.-b')
xlabel('voltage')
ylabel('current')
title('Generated value using interpolated')
%We set limit of x from -17.3 to 0.9
x=-17.3:0.1:0.9;
y=interp1(v,I,x);
hold on; grid on;
% Generated the interpolated data for plot.
plot(v,I,'-r',x,y)
%y is using v,I relationship generated value and save in text file.
writematrix (y,'file_1','Delimiter','tab')
% v is voltage and save in text file.
writematrix (v,'file_2')
%I is current and save in text file.
writematrix (I,'file_3')
Output:
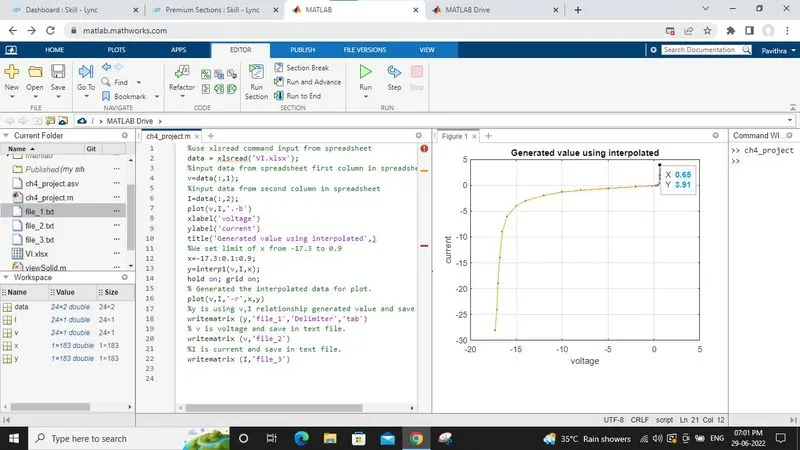 output