Project - Data Handling and Interpolation
Note : 4 files attached to the project
Project – Data Handling and Interpolation
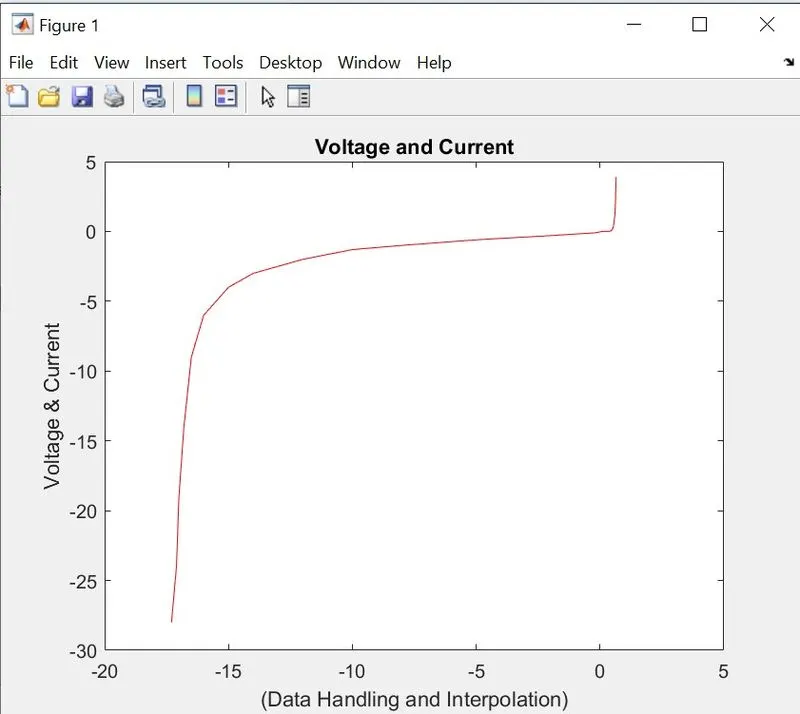
Aim : In a laboratory experiment, data of voltage and current has been recorded and the same is attached in an excel file ( Click on this link VI.xlsx ). Read the excel file in the Matlab program and perform the interpolation in the range of -17.3:0.1:0.9. Generate the interactive plot for the interpolated data and store them in a text file.
Objectives : In Matlab, interpolation is the procedure of including new points within a defined range or a given set of points. It is used to find the missing data in the data set, smoothen the given data set or predict the outcome of the given data set.
Program :
Lab_Experiment=xlsread('VI.xlsx','Sheet1','A2:B25') %reading data from excel file
V=Lab_Experiment(:,1);
I=Lab_Experiment(:,2);
Vr=-17.3:0.1:0.9; %given data condition
Inew = interp1(V,I,Vr,'spline')
figure(1)
plot(V,I,'r');
title('Voltage and Current');
xlabel('(Data Handling and Interpolation)');
ylabel('Voltage & Current');
fid=fopen('vandi.txt','w')
fprintf(fid,' %f n',Vr) %print data in vandi.txt
% plot(t,V,'b');
% hold off
Output :
File Output (Vandi.txt) :
-17.300000
-17.200000
-17.100000
-17.000000
-16.900000
-16.800000
-16.700000
-16.600000
-16.500000
-16.400000
-16.300000
-16.200000
-16.100000
-16.000000
-15.900000
-15.800000
-15.700000
-15.600000
-15.500000
-15.400000
-15.300000
-15.200000
-15.100000
-15.000000
-14.900000
-14.800000
-14.700000
-14.600000
-14.500000
-14.400000
-14.300000
-14.200000
-14.100000
-14.000000
-13.900000
-13.800000
-13.700000
-13.600000
-13.500000
-13.400000
-13.300000
-13.200000
-13.100000
-13.000000
-12.900000
-12.800000
-12.700000
-12.600000
-12.500000
-12.400000
-12.300000
-12.200000
-12.100000
-12.000000
-11.900000
-11.800000
-11.700000
-11.600000
-11.500000
-11.400000
-11.300000
-11.200000
-11.100000
-11.000000
-10.900000
-10.800000
-10.700000
-10.600000
-10.500000
-10.400000
-10.300000
-10.200000
-10.100000
-10.000000
-9.900000
-9.800000
-9.700000
-9.600000
-9.500000
-9.400000
-9.300000
-9.200000
-9.100000
-9.000000
-8.900000
-8.800000
-8.700000
-8.600000
-8.500000
-8.400000
-8.300000
-8.200000
-8.100000
-8.000000
-7.900000
-7.800000
-7.700000
-7.600000
-7.500000
-7.400000
-7.300000
-7.200000
-7.100000
-7.000000
-6.900000
-6.800000
-6.700000
-6.600000
-6.500000
-6.400000
-6.300000
-6.200000
-6.100000
-6.000000
-5.900000
-5.800000
-5.700000
-5.600000
-5.500000
-5.400000
-5.300000
-5.200000
-5.100000
-5.000000
-4.900000
-4.800000
-4.700000
-4.600000
-4.500000
-4.400000
-4.300000
-4.200000
-4.100000
-4.000000
-3.900000
-3.800000
-3.700000
-3.600000
-3.500000
-3.400000
-3.300000
-3.200000
-3.100000
-3.000000
-2.900000
-2.800000
-2.700000
-2.600000
-2.500000
-2.400000
-2.300000
-2.200000
-2.100000
-2.000000
-1.900000
-1.800000
-1.700000
-1.600000
-1.500000
-1.400000
-1.300000
-1.200000
-1.100000
-1.000000
-0.900000
-0.800000
-0.700000
-0.600000
-0.500000
-0.400000
-0.300000
-0.200000
-0.100000
0.000000
0.100000
0.200000
0.300000
0.400000
0.500000
0.600000
0.700000
0.800000
0.900000
Result : Thus by using the interp1 condition we get the missing data in a Laboratory Experiment and we have printed it in a vandi.txt file giving a range of a numbers we are able to get the missing data with help of fid=fopen, fprintf,write(w).