Project - Data Handling and Interpolation
answer =
vi_data  = xlxread('VIxlsx'); % read exel file by matlab name vixlsx
x = [10 35: 20 45: 30 55];% put manually the data from xel file into the x
y = sin(x);% Y AXIS DEFINED
xq = [-17.3 :0.1:0.9];% given interpolation value
yq1 = interp1(x,y,xq);% interpolated by yq1
plot (x,y,'r',xq,yq1,'b');grid;% plotted all variable x,y,xq,yq1 to get graph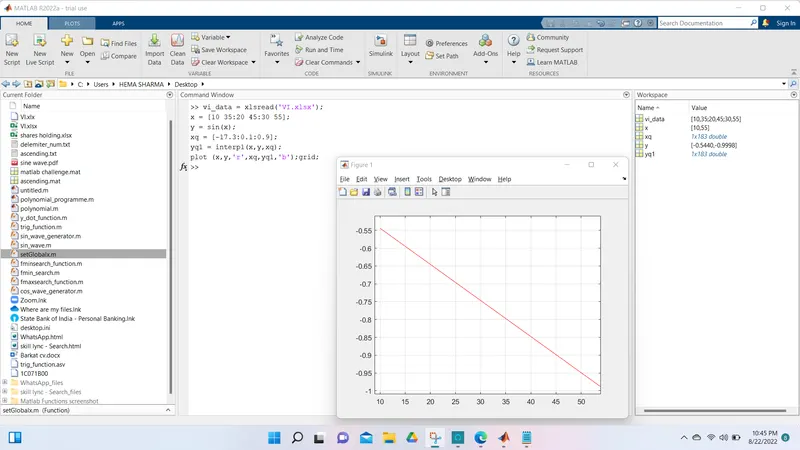
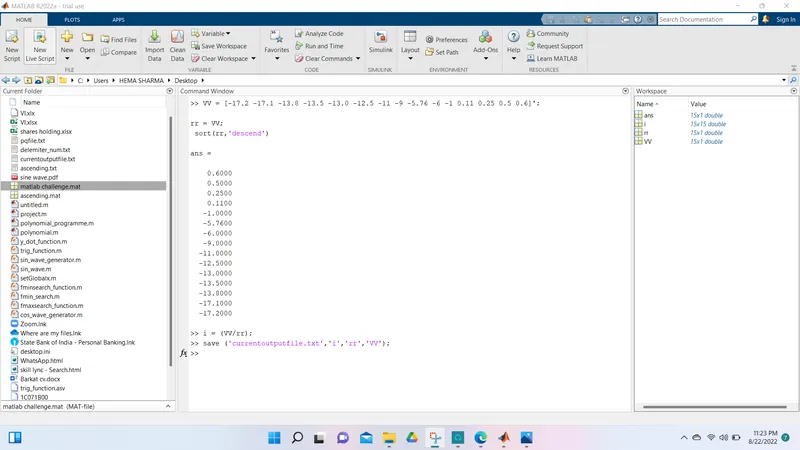
VV = [-17.2 -17.1 -13.8 -13.5 -13.0 -12.5 -11 -9 -5.76 -6 -1 0.11 0.25 0.5 0.6]';%taken the values from question to compute the current so considered as a voltage values

rr = VV;% assumed by VV to rr descending as a resistance values
 sort(rr,'descend')

ans =

    0.6000
    0.5000
    0.2500
    0.1100
   -1.0000
   -5.7600
   -6.0000
   -9.0000
  -11.0000
  -12.5000
  -13.0000
  -13.5000
  -13.8000
  -17.1000
  -17.2000

>> i = (VV/rr);% computed the current values by formula v = IR ,so I =V/R
>> save ('currentoutputfile.txt','i','rr','VV');%saved the file as text file
>>