Project - Data Handling and Interpolation
PART1
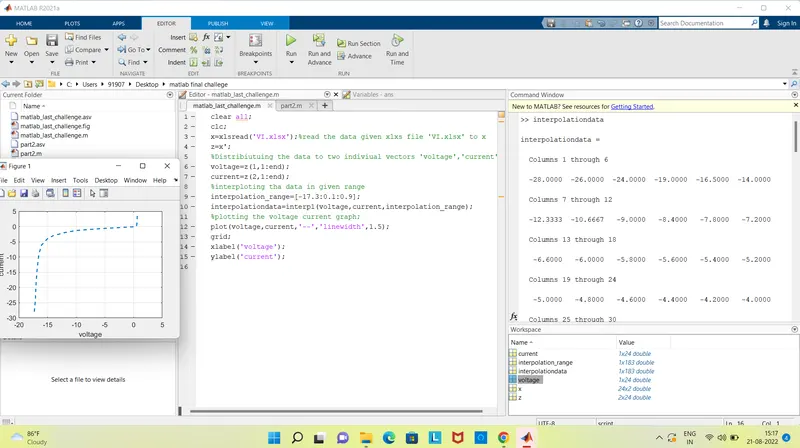
clear all;
clc;
x=xlsread('VI.xlsx');%read the data given xlxs file 'VI.xlsx' to x
z=x';
%Distribiutuing the data to two indiviual vectors 'voltage','current'
voltage=z(1,1:end);
current=z(2,1:end);
%interploting tha data in given range
interpolation_range=[-17.3:0.1:0.9];
interpolationdata=interp1(voltage,current,interpolation_range);
%plotting the voltage current graph;
plot(voltage,current,'--','linewidth',1.5);
grid;
xlabel('voltage');
ylabel('current');
PART2
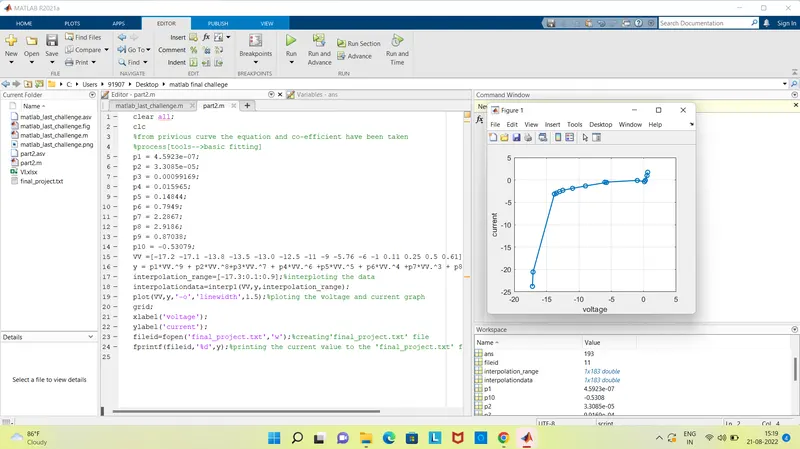
clear all;
clc
%from privious curve the equation and co-efficient have been taken
%process[tools-->basic fitting]
p1 = 4.5923e-07;
p2 = 3.3085e-05;
p3 = 0.00099169;
p4 = 0.015965;
p5 = 0.14844;
p6 = 0.7949;
p7 = 2.2867;
p8 = 2.9186;
p9 = 0.87038;
p10 = -0.53079;
VV =[-17.2 -17.1 -13.8 -13.5 -13.0 -12.5 -11 -9 -5.76 -6 -1 0.11 0.25 0.5 0.61]';
y = p1*VV.^9 + p2*VV.^8+p3*VV.^7 + p4*VV.^6 +p5*VV.^5 + p6*VV.^4 +p7*VV.^3 + p8*VV.^2 +p9*VV + p10 ;
interpolation_range=[-17.3:0.1:0.9];%interploting the data
interpolationdata=interp1(VV,y,interpolation_range);
plot(VV,y,'-o','linewidth',1.5);%ploting the voltage and current graph
grid;
xlabel('voltage');
ylabel('current');
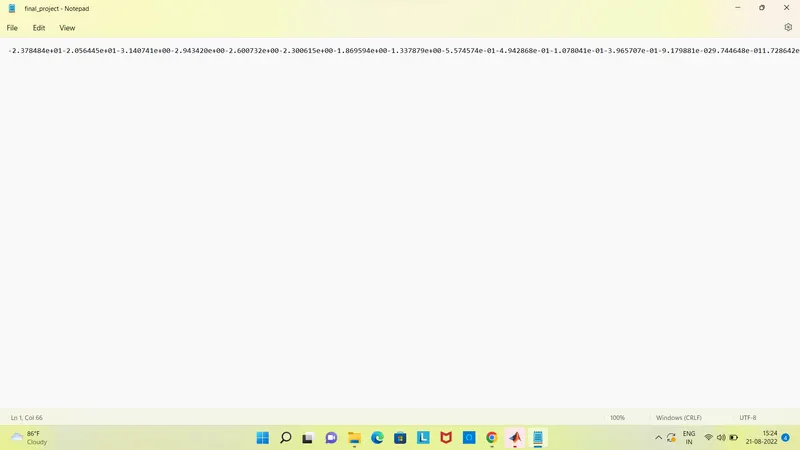
fileid=fopen('final_project.txt','w');%creating'final_project.txt' file
fprintf(fileid,'%d',y);%printing the current value to the 'final_project.txt' file