Project - Data Handling and Interpolation
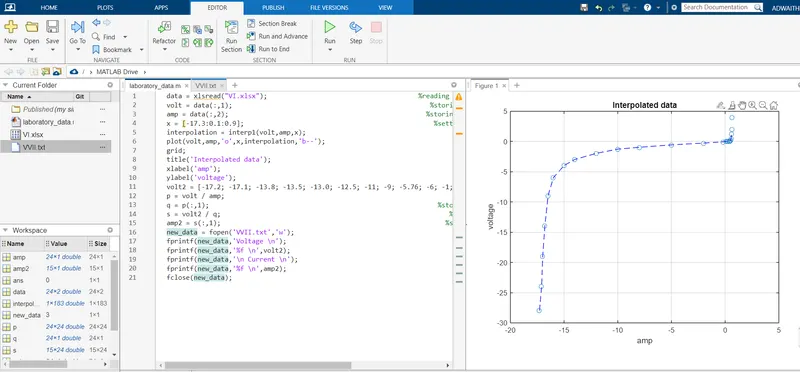
data = xlsread("VI.xlsx"); %reading data from .xls file
volt = data(:,1); %storing the voltage
amp = data(:,2); %storing the current
x = [-17.3:0.1:0.9]; %setting the range
interpolation = interp1(volt,amp,x); %using interpolation function
plot(volt,amp,'o',x,interpolation,'b--'); %to plot the graph
grid;
title('Interpolated data');
xlabel('amp');
ylabel('voltage');
volt2 = [-17.2; -17.1; -13.8; -13.5; -13.0; -12.5; -11; -9; -5.76; -6; -1; 0.11; 0.25; 0.5; 0.61];
p = volt / amp; %equation to find resistance
q = p(:,1); %storing resistance
s = volt2 / q; %equation to find current
amp2 = s(:,1); %storing current
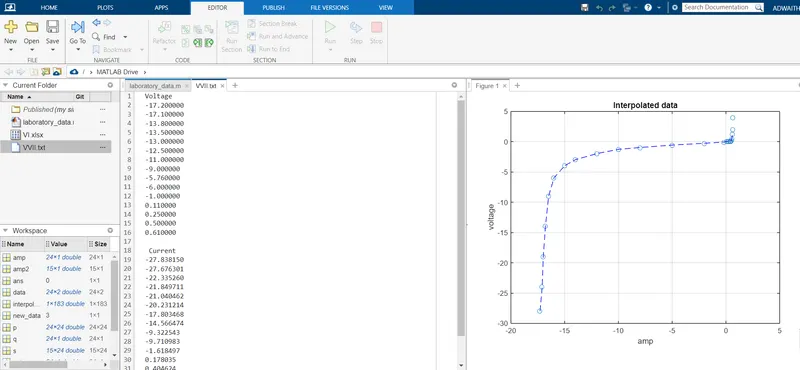
new_data = fopen('VVII.txt','w'); %openingn a .txt file
fprintf(new_data,'Voltage \n'); %writing the .txt file
fprintf(new_data,'%f \n',volt2);
fprintf(new_data,'\n Current \n');
fprintf(new_data,'%f \n',amp2);
fclose(new_data); %closing the .txt file