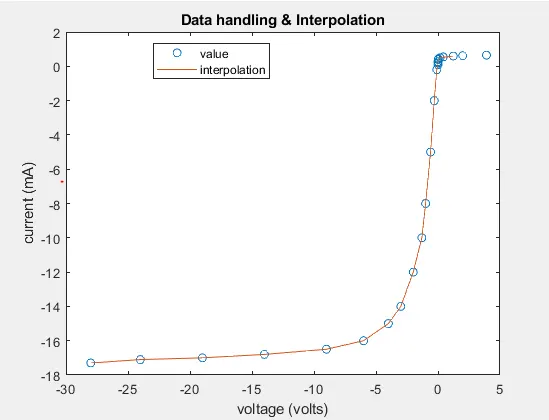
Project - Data Handling and Interpolation
% Project # Basic Matlab:
clc
close all
clear all
vi=xlsread('VI.xlsx','A2:A25');% Read the current values from VI.xls file
vv=xlsread('VI.xlsx','B2:B25'); % Read the voltage values from VI.xls file
xq=(-17.3:0.1:0.9); %intervals
yq=interp1(vi,vv,xq);%interpolation for values of xq
plot(vv,vi,'o',yq,xq,'-') %plote the vv v/s vi with(o) & interpolation values
title('Data handling & Interpolation') % title added to graph
legend('value','interpolation') %added legend
xlabel('voltage (volts)') %added x-axis label as voltage
ylabel('current (mA)') %added y-axis label as current
VV=[-17.2;-17.1;13.8;-13.5;-13.0;-12.5;-11;-9;-5.76;-6;-1;0.11;0.25;0.5;0.61];
I=interp1(vi,vv,VV);% computing interpolation with given data VV
Z=[VV I] % move interpolating values to Z matrix
fid=fopen('VI.txt','w'); % created VI.text file
fprintf(fid,'%d\n',Z); % stored values of Z matrix to VI.text file
Ans-