Project
Aim: Preparation of a technical report after carrying out a system-wide simulation of an all-terrain vehicle.
Objectives: Carry out a system wide simulation of an all terrain vehicle and preparation of a technical report.
What is an all-terrain vehicle(ATV)?
Ans: Also known as light utility vehicle, it is a vehicle travelling on low pressure tyres, with a seat straddled by the operators along with steering control. Suzuki was a leader in the mass production of ATVs. Then the Yamaha motor company founded the Banshee 350 model with a twin cylinder, liquid cooled two stroke motor.
Case 1:
SIMULINK MODEL FOR ALL-TERRAIN VEHICLE(ATV)
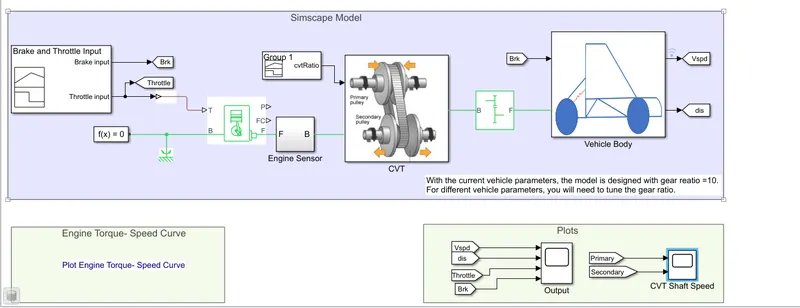
Major components :
Continuous Variable Transmission Drive(CVT):
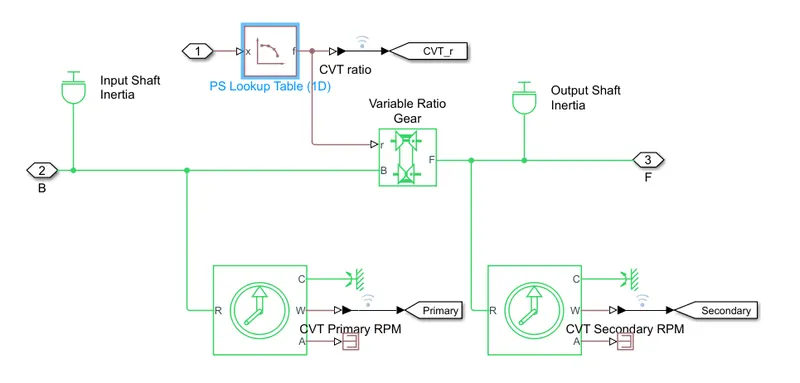
It is an automatic transmission system which seamlessly changes using a number of gear ratios. The flexibility of a CVT uses suitable control that allows the engine to operate at a constant rpm. The most common type uses two pulleys connected by a belt or a chain.
The CVT block is shown below:
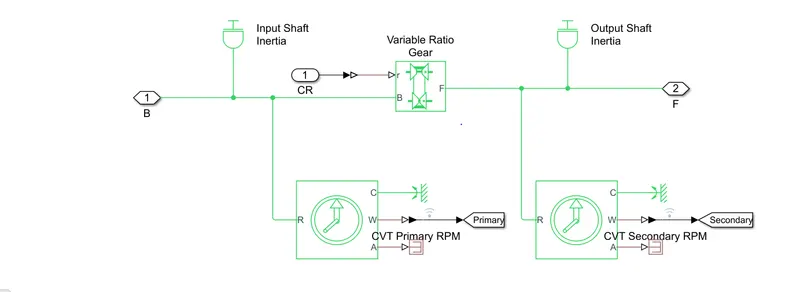
Variable Transmission ratio: It is represented by a variable ratio gearbox which is implemented by a mechanical belt CVT.
Engine: It is represented by a system level spark engines and diesel engines which are used at initial stages of modeling.
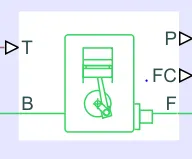
The diagram of an engine used in the model is shown.
Input Signal: We have used a signal builder for brake and throttle inputs.
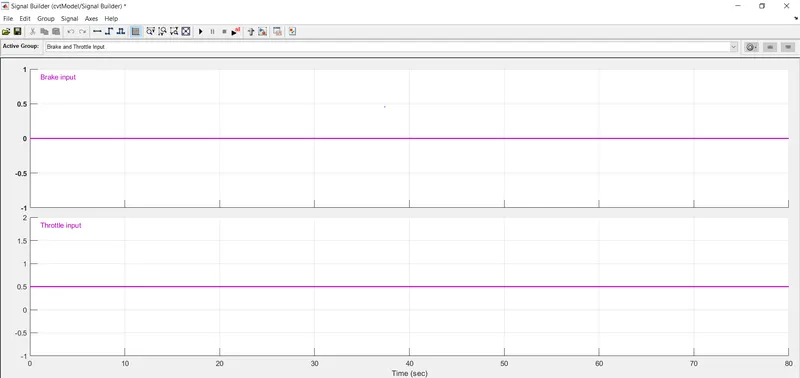
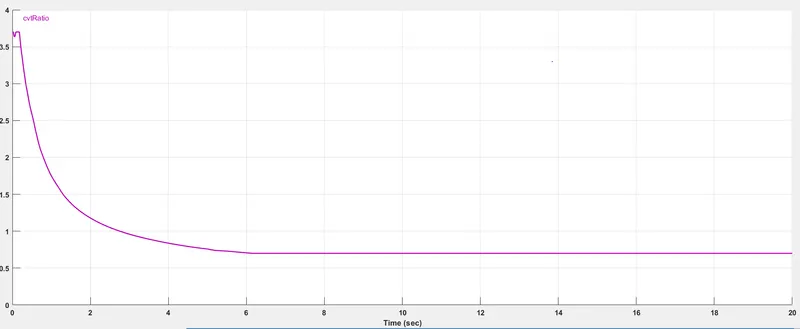
The CVT Gear Ratio input is shown below:
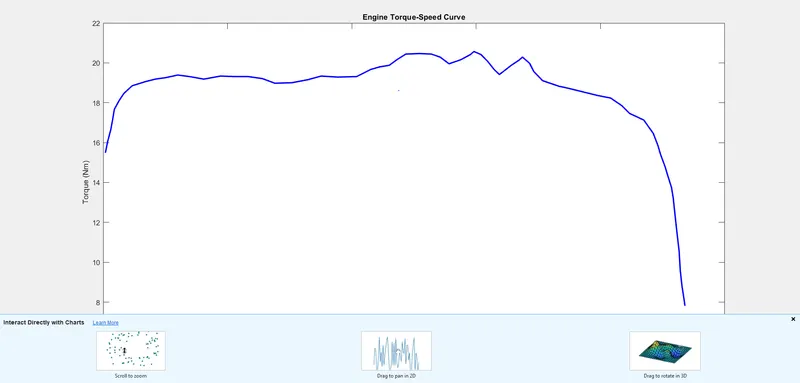
The Torque speed input is shown below:
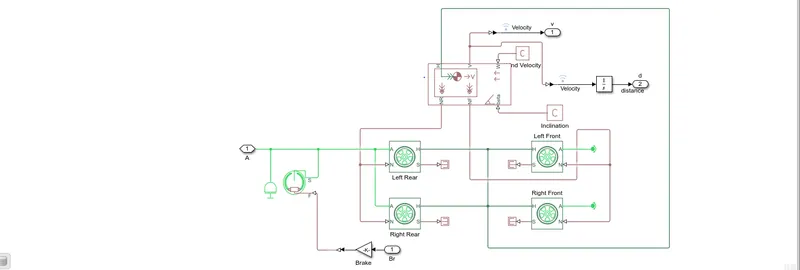
The vehicle body along with its gears, wheels and vehicle body is also shown below:
Output for case 1:
For getting the output of velocity output and signal builder outputs.
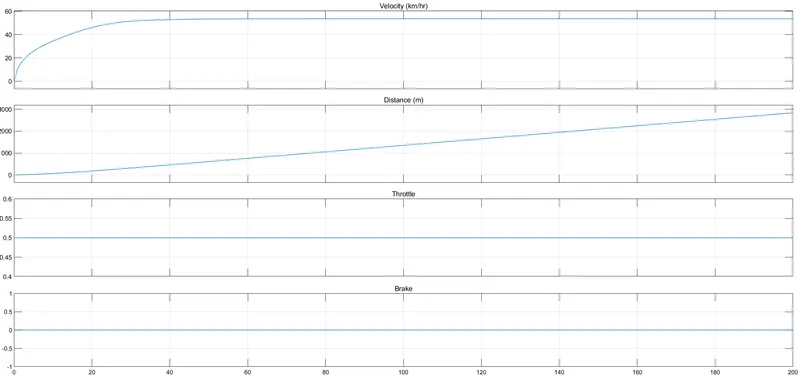
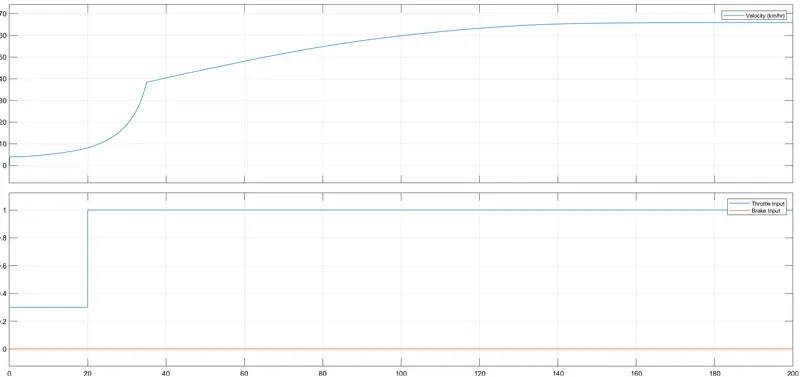
From the output graph it is clear that the maximum velocity occurs at 55km/hr and after that it remains constant.
CVT Shaft RPM Output:
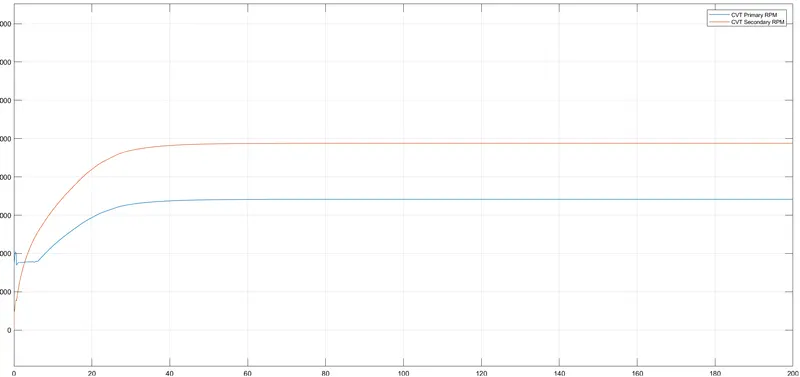
The angular velocities variation in input and output shafts of variable gear transmission is shown in the above graph. The values are different for different gear ratios.
Case 2: BAJA ATV CTV modeling using dashboard.
The simulink model is shown below:
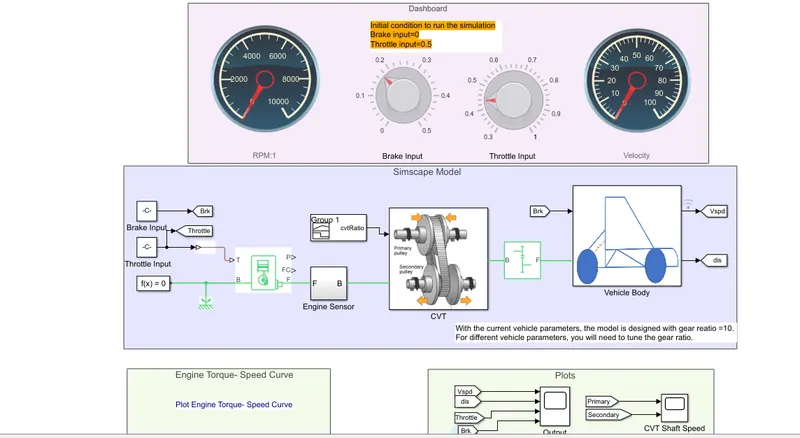
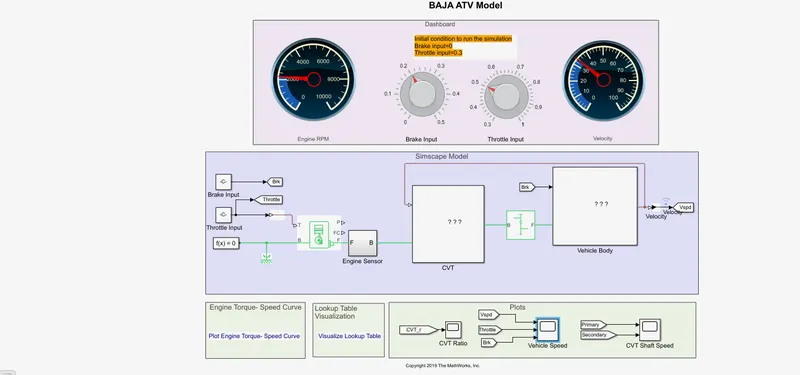
In this case we have a dashboard that contains knobs to control the inputs where the inputs 'throttle' and 'brake' are not given input in the form of a signal builder but knobs are used to control both of them.
The outputs is shown below:
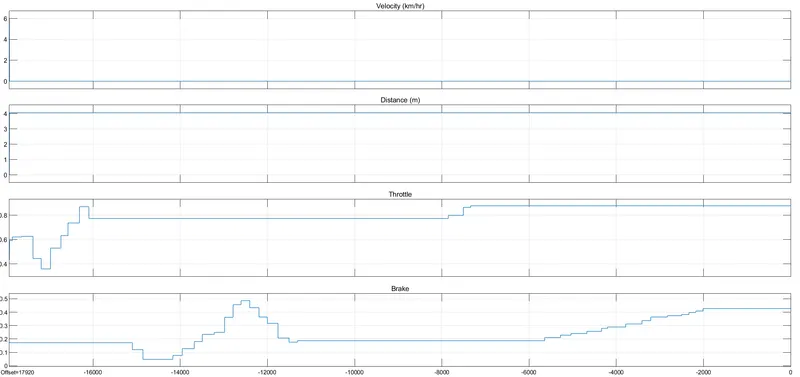
From the above it can be seen that after a drastic change, the speed remains constant for a certain amount of time and the valued of brake and throttle changes with respect to time.
This explains a direct relationship between the vehicle velocity and throttle input.
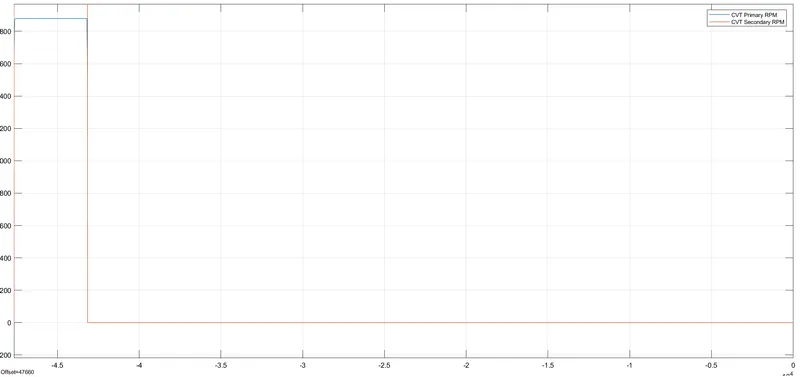
Graph of CVT shaft speed:
case 3: Simulink model of Baja ATV with CVT using Lookup table
The simulink model diagram is shown below:
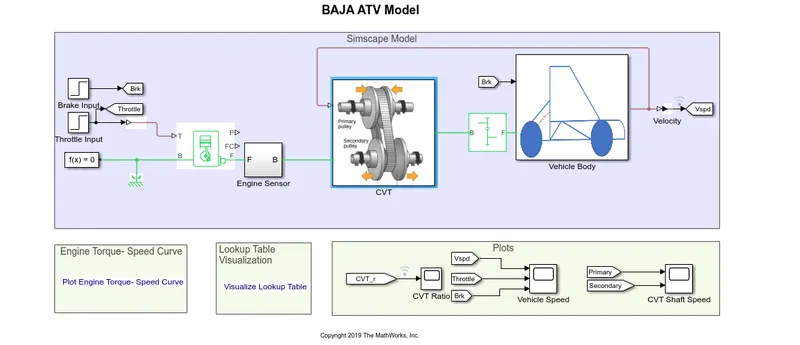
The CVT block is shown below:
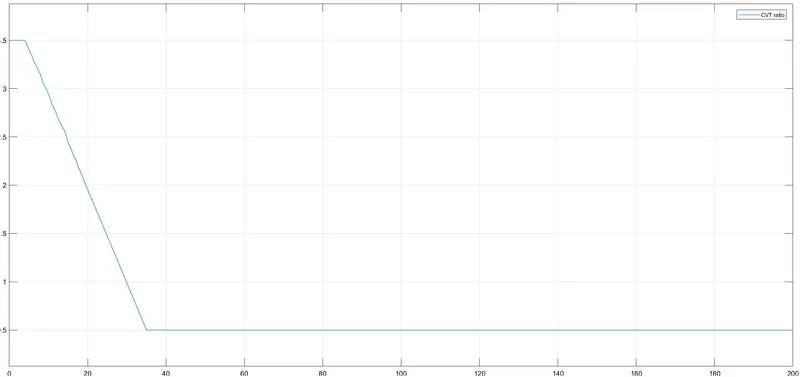
The output of the graphs is shown below:
The CVT gear ratio is shown below:
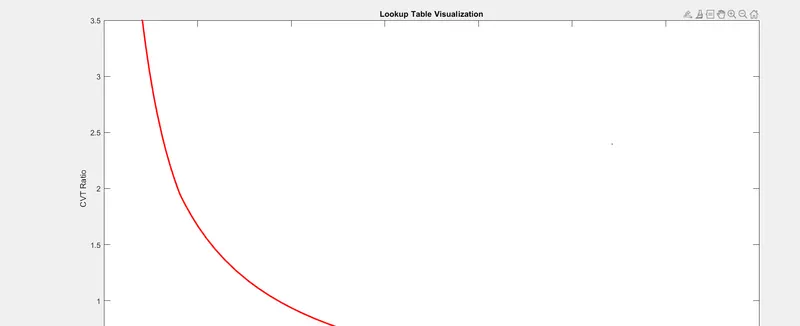
The look up table visualization is shown below:
The output for Vehicle speed is shown below:
The output for CVT shaft RPM is shown below:
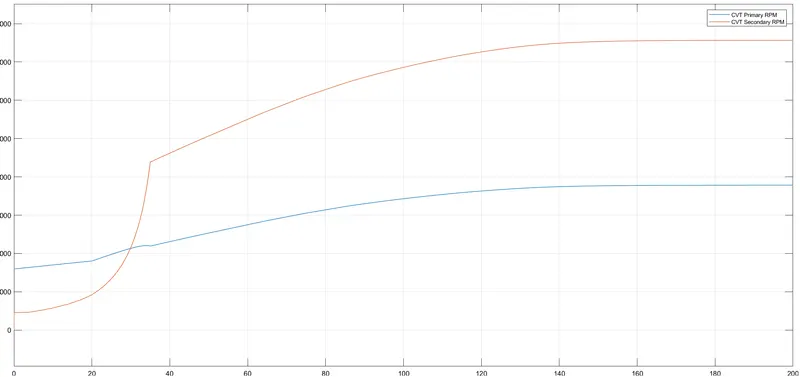
As both the parameters are same, both the results are the same as the first case.
Case 4: Simulink model of BAJA ATV with CVT using look up table and dashboard:
The Simulink diagram is shown below:
Output for case 4:
Vehicle speed:
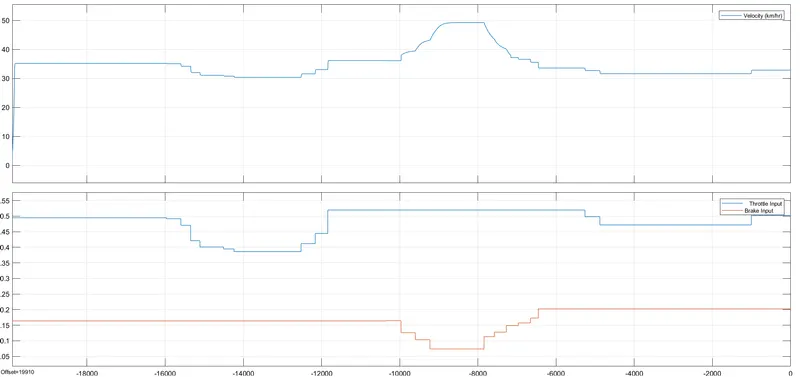
The graph is almost the same as that of a CVT dashboard case. The vehicle velocity changes with the change in throttle and brake given as inputs.
CVT Shaft RPM output:
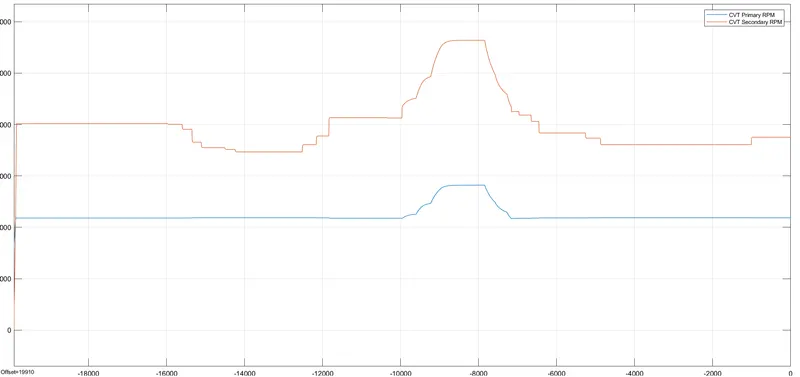
This graph gives us an idea about the variation in speed in primary and secondary shafts with respect to input parameters which are throttle and break.
Conclusion:
We have successfully analysed the four different cases with models and outputs. We have also recorded the outputs by varying the inputs like throttle and brake etc.