Project
Aim:
- To perform Simulation of BAJA All-terrain Vehicle(ATV) that uses a CVT and analyse the result from different input method.
Objective:
- To study, open and closed loop ATV model.
- To understand the input methods like lookup table ,dashboard blocks and signal builder models.
Method:
-CVT: CVTs stand for Continuously Variable Transmissions is an automatic transmission that can change seamlessly through a continuous range 0f gear ratio. This contrast with other transmission that provides a limited number of gear ratios in fixed steps.The flexibility of a CVT with suitable control may allow the engine to operate at a constant rpm while the vehicle moves at varying speed.
- In its simplest form it can be explained as there are two pulleys when one pulley contracts the other one expands. This contraction and expansion also results in changing the area of contact of the belt varrying accordingly.For example,if the primary pulley is in the contracted position that means more area of belt is in contact with the pulley and on the other hand the secodary pulley is going to be in an expanded position.This results in bigger pulley at one end and smaller at othes.Which means if the input pulley is bigger and output is smaller, for 1 rotation of input pulley output pulley will rotate more number of turns and a speed reduction will be achieved.
-On the other hand, if input pulley is smaller (expanded)and output pulley is bigger(contracted) speed reduction will be there,as for several rotations of input pulley the output pulley will rotate by single rotation and a speed reduction will be achieved.
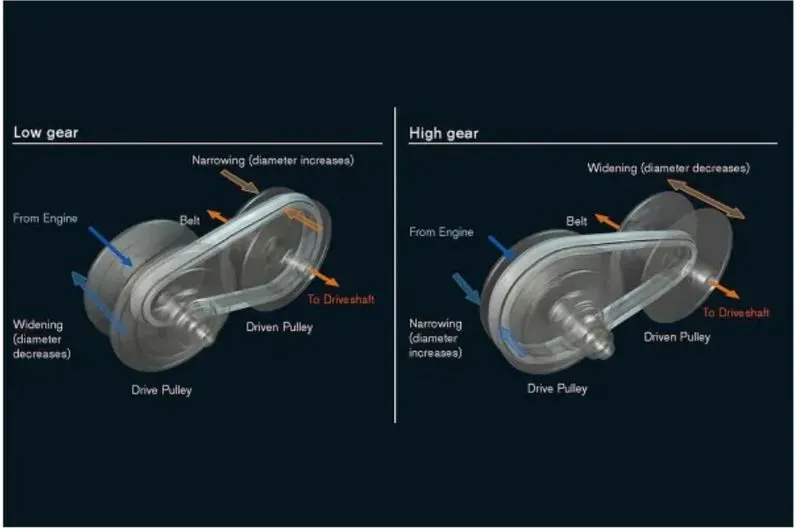
-The step-less nature of its of its design allows the CVTto work to keep the engine in its optimum power range, increasing and fuel mileage by delivering an infinite number of smooth transirions from low to high.
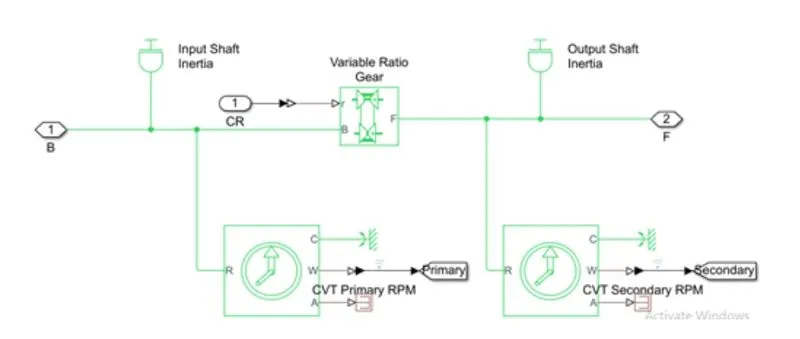
-Both the base and the follower (primaary and secondary) are given inertia elements to make the model more realistic.Rotational motion sensors are connected to measure the rpm of both sides.
- The most common type of CVT usus two pulleys connected by a belt or chain.Depending upon the position of variator of the secondary and primary pulley, speed reduction and overdrive takes palce.
- In order to connect engine and CVT a speed reduction is necessary and it is achieved using a gear ratio with a gear ratio of 4.
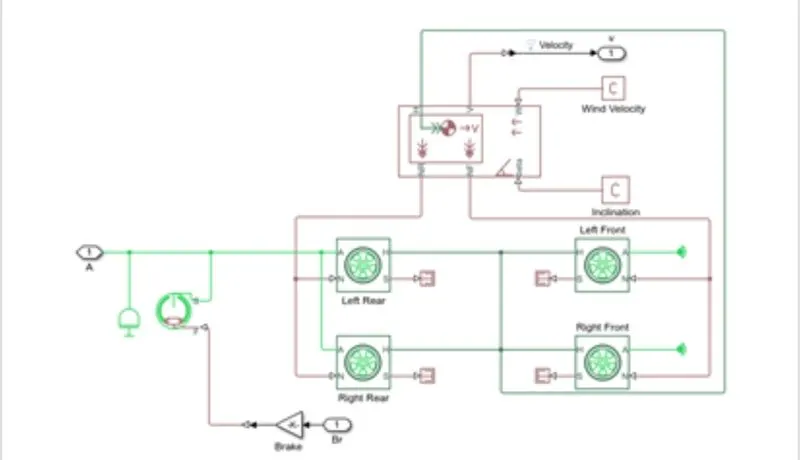
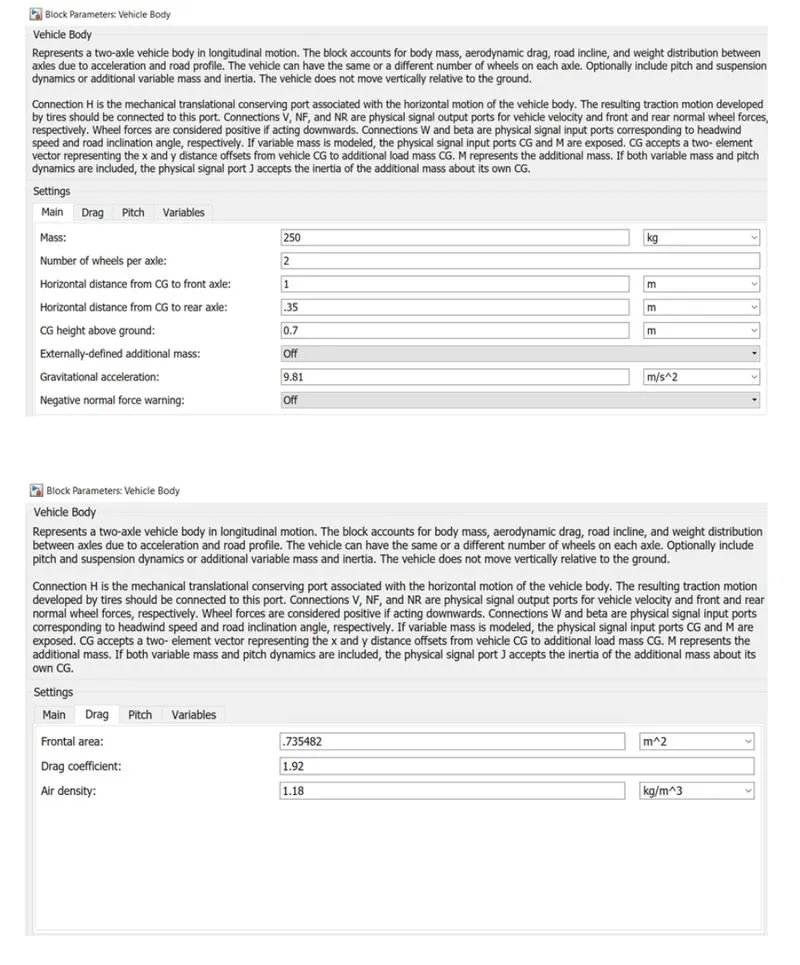
- The four wheels are connected accordingly and rpm of the secondary of CVT and brake input is given to the subsystem.The vehicle body is given zero inclinnation and wind velocity.The velocity is taken to the scope by using an output block.
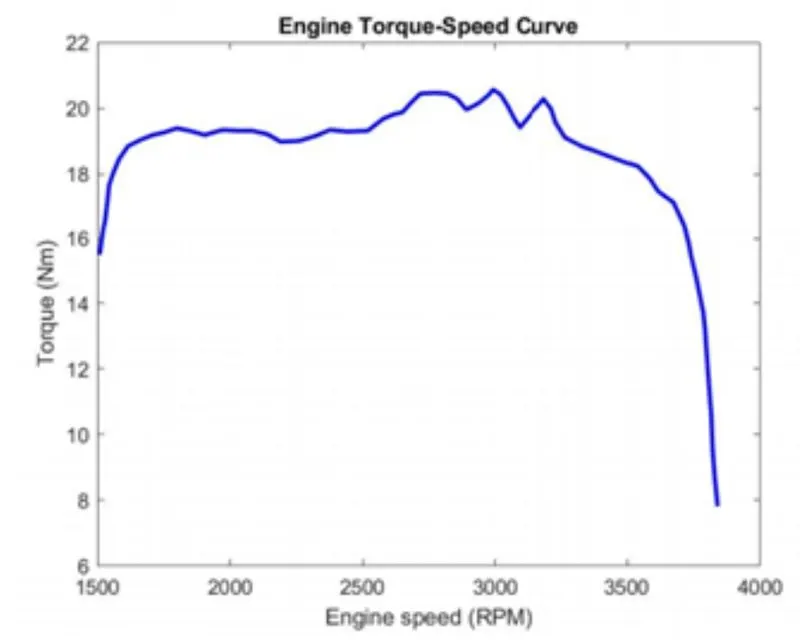
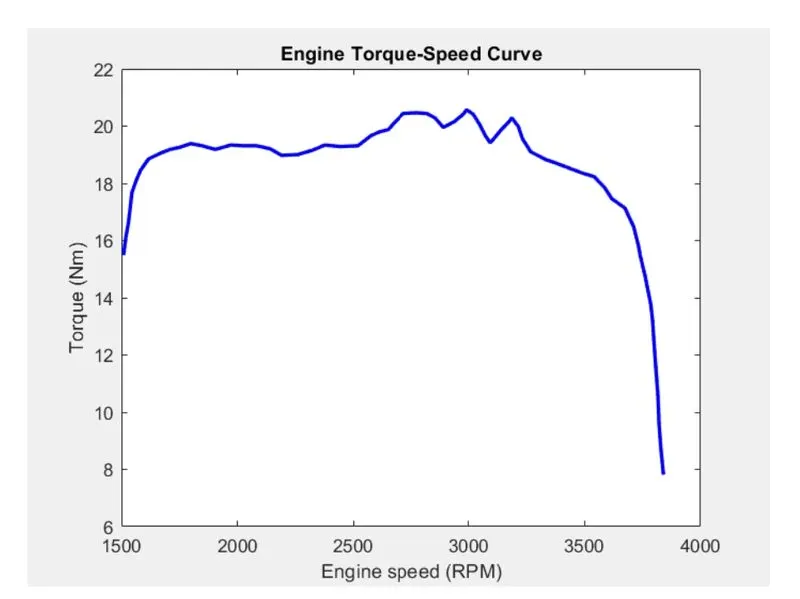
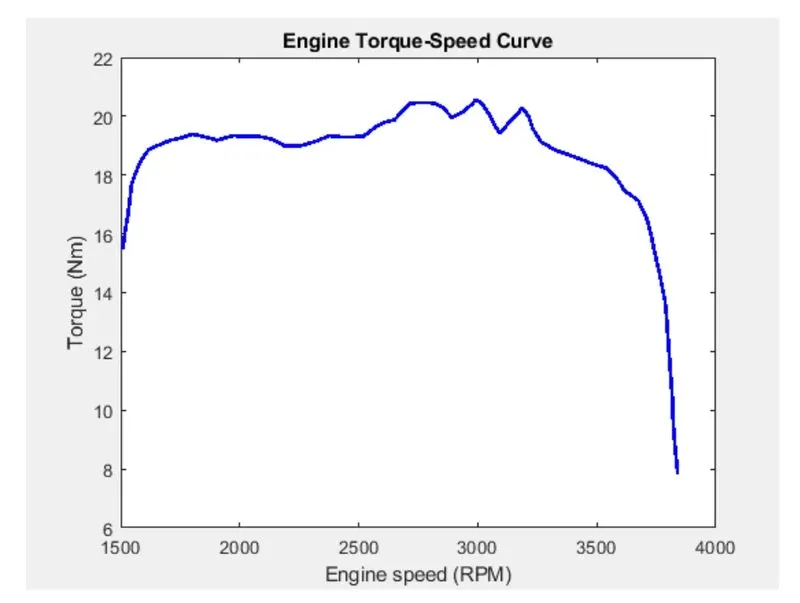
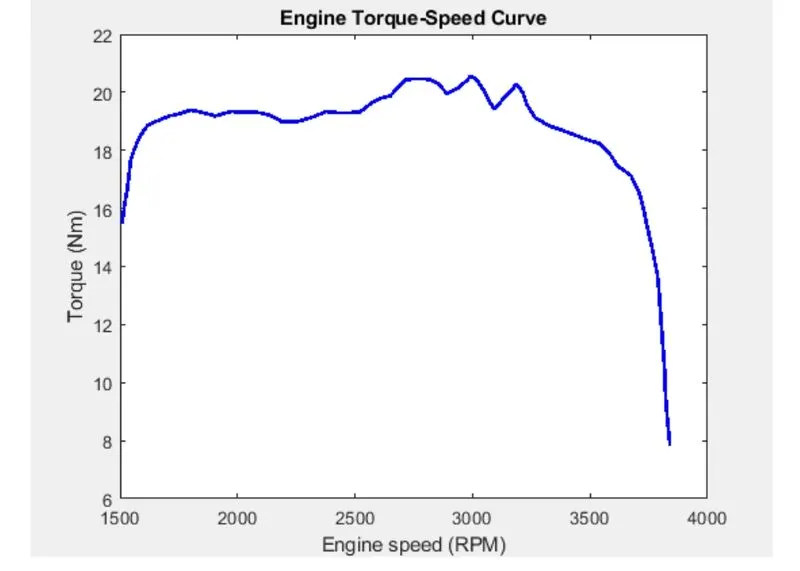
- In order to give inputs the speed and the torque values are taken from the curve.
The curve is represented below:
- Lookup Table:
- These are used to map output based in input given. The output data corresponding to input is linked using a data array defined in the lookup table. Lookup table improves accuracy and reduce the time. Using intrapolation and extrapolation Simulink can extract other data.
- The lookup table in this model gives the CVT ratio as output for respective input vehicle speed. In order to calculate the CVT ratio, the vehicle speed is feed back to CVT subsystem, where using the table block it is calculated.
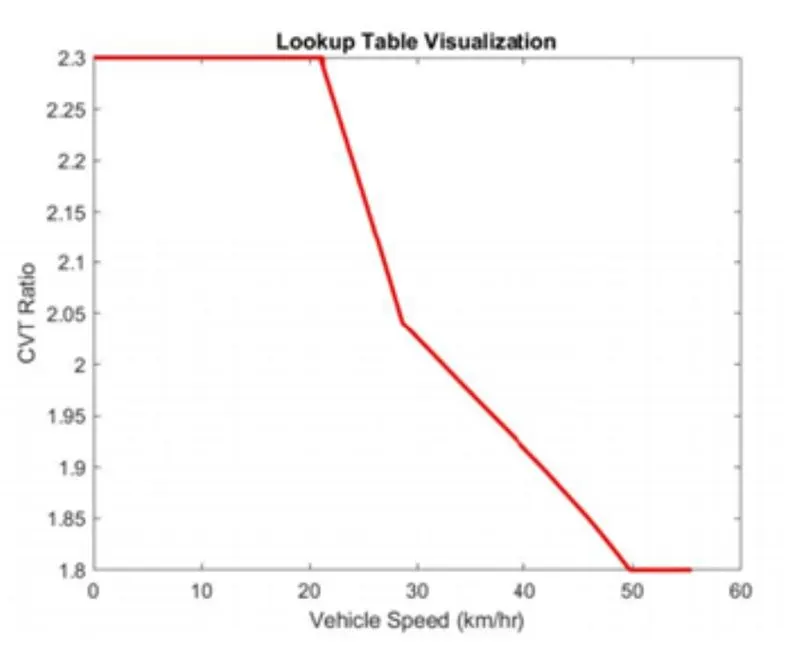
- Data instructor is also used to run the simulation for multiple masses.
Study 1: Simulation of BAJA ATV model with CVT.
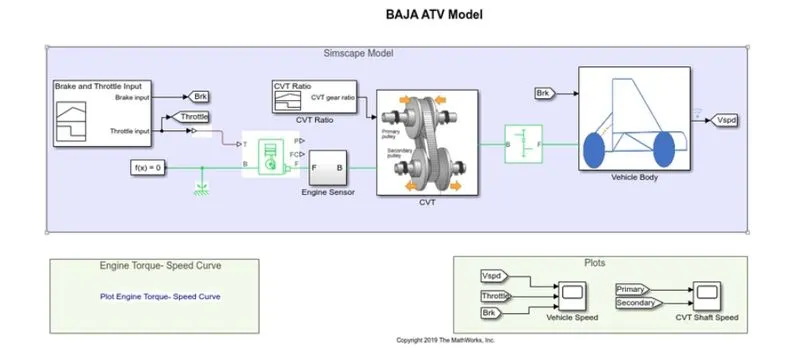
The image depicted below represents the subsystem used to form the model.
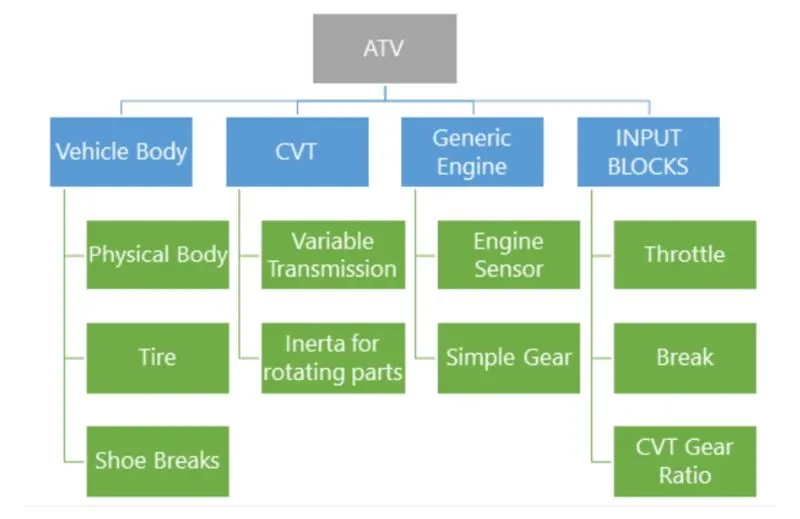
Inputs to the model and block used:
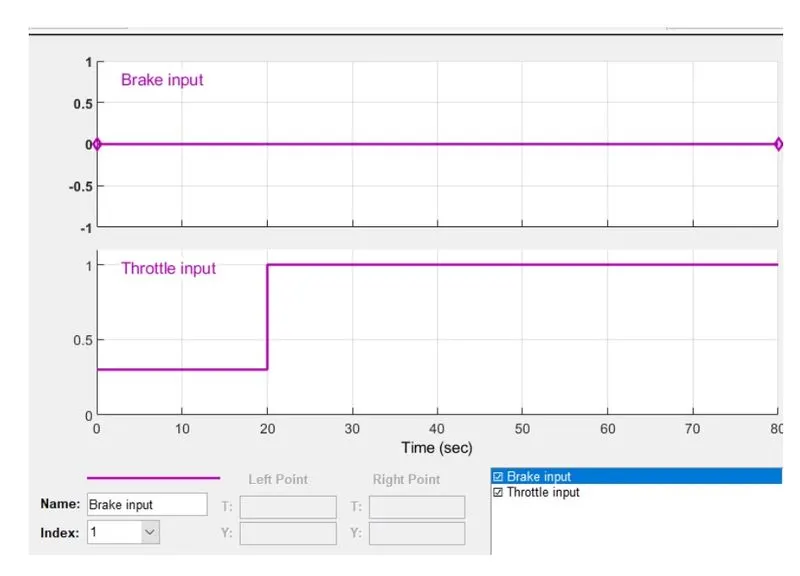
- There are two inputs provided using signal builder one is the break input given a 0 value other is a throttle input which has a value of 0.25 to 20 s, and is increased to 1 and remains same for total 80 s. Both these are fed to the generic engine.
Generic Engine Block
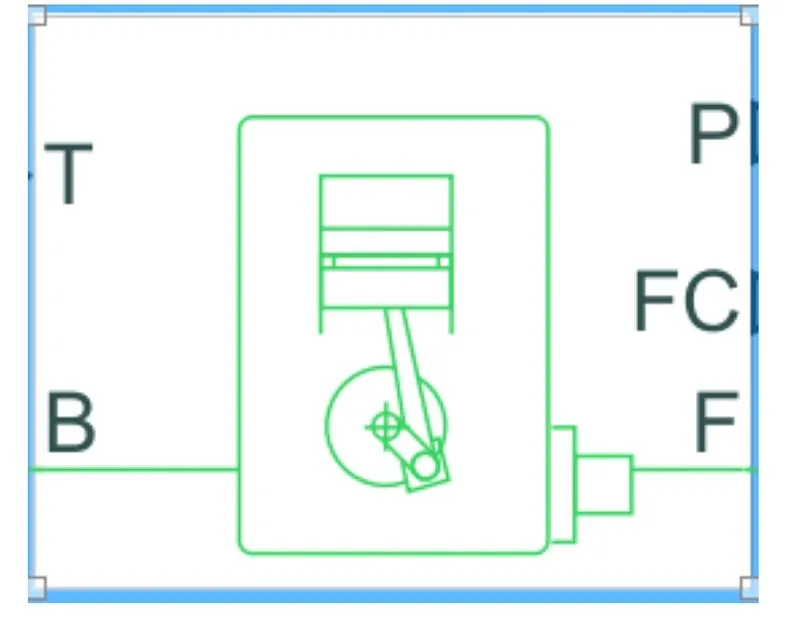
- The throttle which is input fed to T import.This establishes a relation between speed and torque. Connections F and B mechanical rotational conserving ports associated with the engine crankshaft and engine block respectively. Connection P and FC are physical signal output ports through which engine power and fuel consumption rate found out and transmitted to further systems.The port F is connected to a sensor which finds the angular velocity and displacement of the crankshaft.
- In the model in order to restrict a high rpm from the engone gear is used before feeding the rpm values to the CVT.
- The engine speed-torque characteristics are also representd above.
CVT
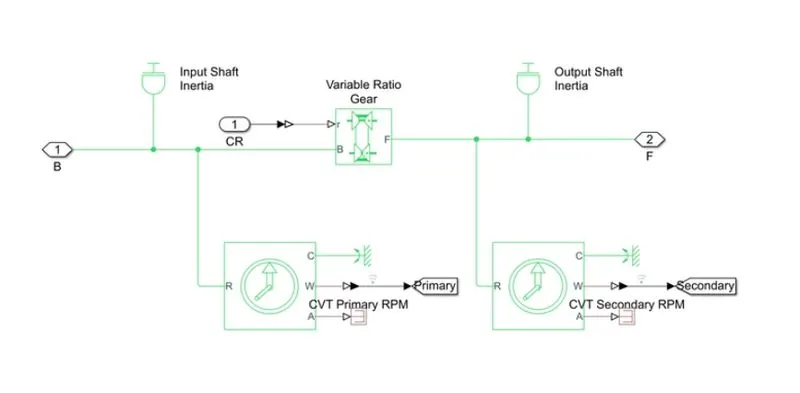
There are two pulleys a primary which is the driver and secondary which is driven.
These have an input and output shaft inertia respectively.
The variable-gear ratio gear block provides the different gear ratios (represents multiple gear of CVT).
The gear ratio input is fed to the R port of the above block.
The angular velocity of the two pulleys is tracked using ideal rotational sensors.
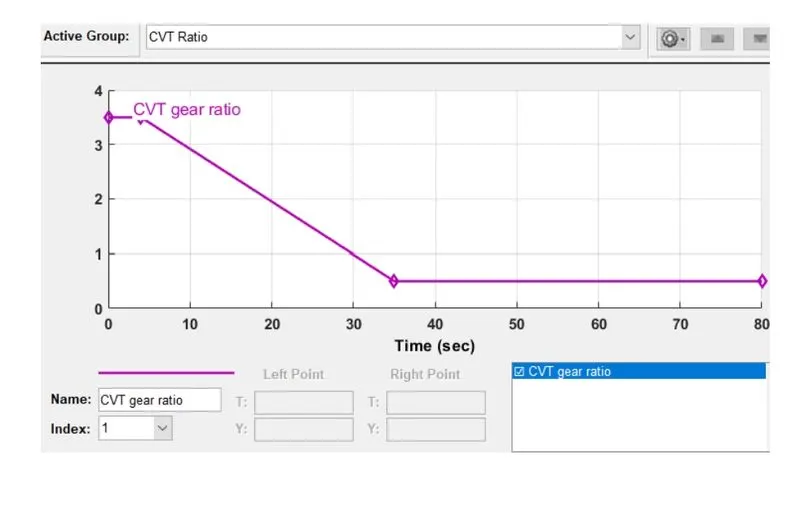
The input to the CVT is defined using a signal builder block.
- Result and the Observation for case 1
a) Engine Torque Vs Speed:
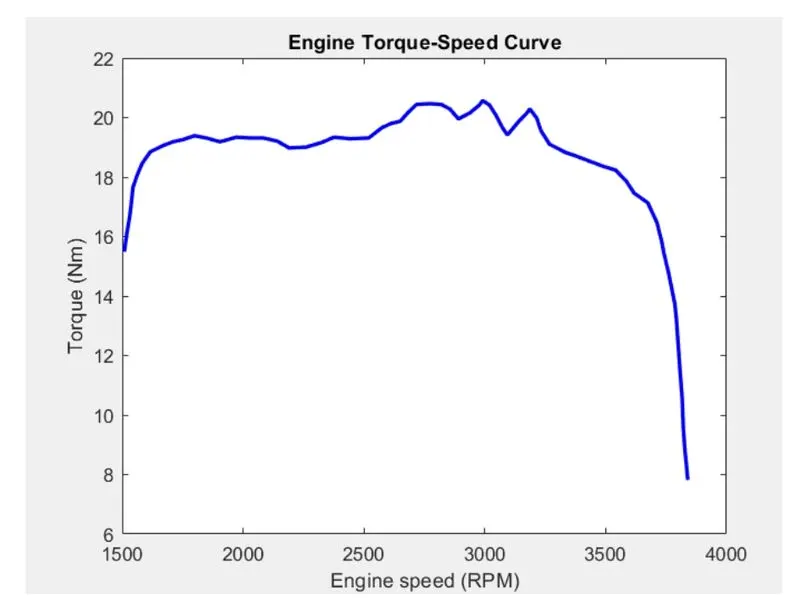
The value of stsrting torque is very high which is needed for pick up.
b) Vehicle Speed curve:
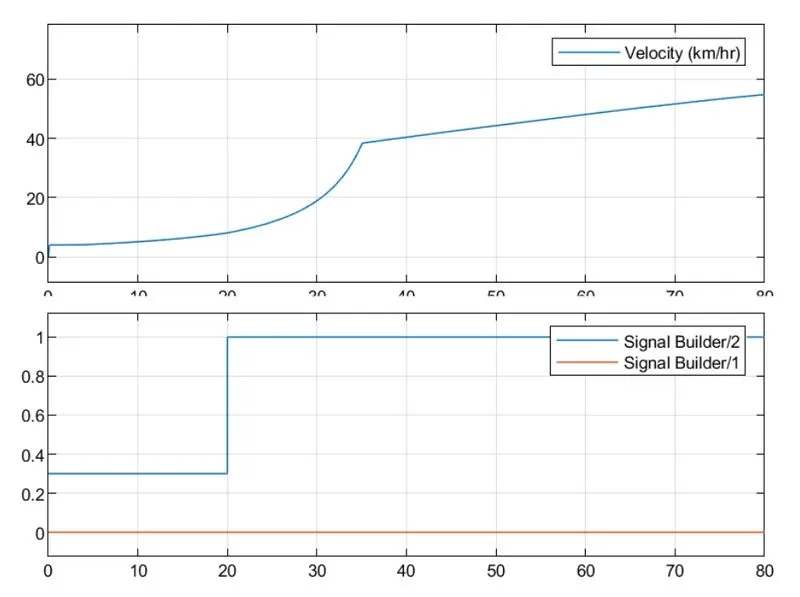
The throttle input changes from 0.3 to 1 after 20 s.That can be seen in the graph that as a change in throttle occours similar to wot and the lack of a brake the vehicle speed keeps on increasing till it attains a top speed.
3) CVT shaft speed:
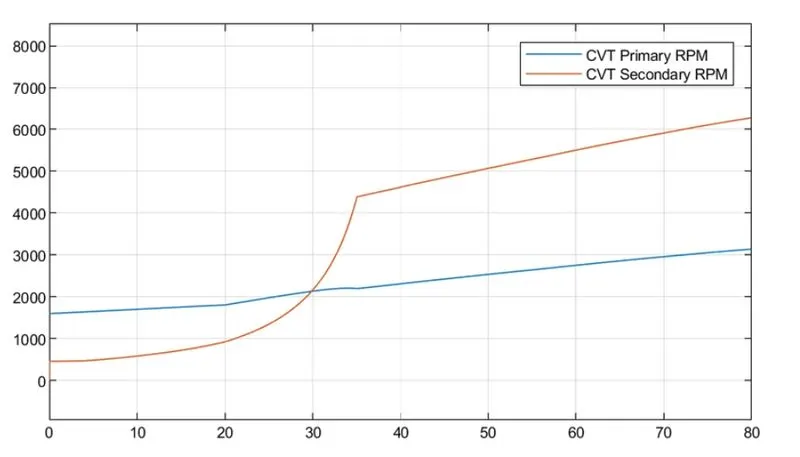
The effect on CVT can be studied by dividing the above into 3 intervals.
1st- 0 to 20s - During the initial period the CVT ratio is high. This can be visualized as synonymous to gear ratio. By defination, in terms of rpm, it is the speed of input shaft to speed to the output speed in this context. During this period the driver will have a small diameter and the driven will have larger diameter to facilatate the demand for high torque. CVT ratio: 0 to 10s,>2 whereas >30s,0.5.
2nd- When there is an increase in throttle value, the speed of the vehicle increases. As this happens the driver starts to increase its diameter thereby a decrease in gear ratio to provide more rpm at driven.
3rd- When there is an increase in the speed of the vehicle it can be seen that there is an increase in rpm of driven (secondary) compared to that of the primary.This means that the first pulley bwill have a larger diameter for a higher rpm and for one rotation of a large pulley there will be more rotation of driven.CVT ratio keeps on decreasing.
Case 2: Simulation of BAJA ATV model with CVT and dashboad.
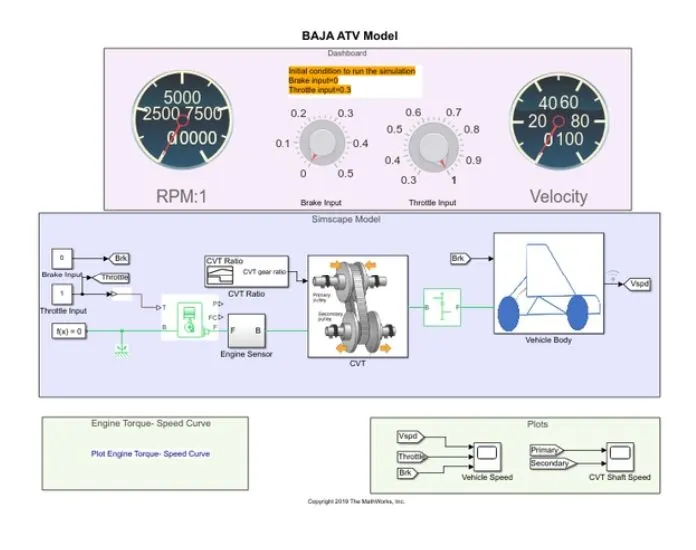
- In the first case the inputs throttle and brake was given as signal builder.But here there are knobs to control the input variables and can be controlled real-time.
- The input knob for throttle starts to 0.3 whereas break knob is set at 0. The speed is increased in real-time and the brake as well.
Result and Observation for case 2.
a) Engine Torque Vs Speed:
b) Vehicle Speed Curve:
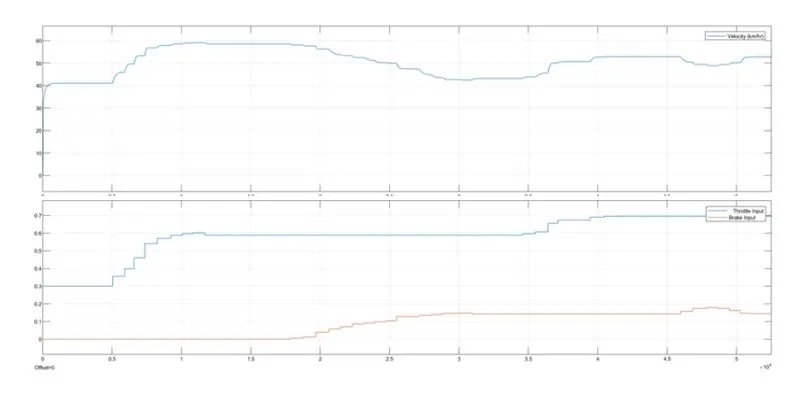
The brake input is not changed for the first three seconds whereas the input value of the throttle is changed gradually and at 0.7 at t=1.5.For this period of time, the speed of the vehicle keeps on increasing.After 1.5s,the brake input input is changed from 0 gradually which creates a decrease in speed.
3) CVT Shaft Speed:
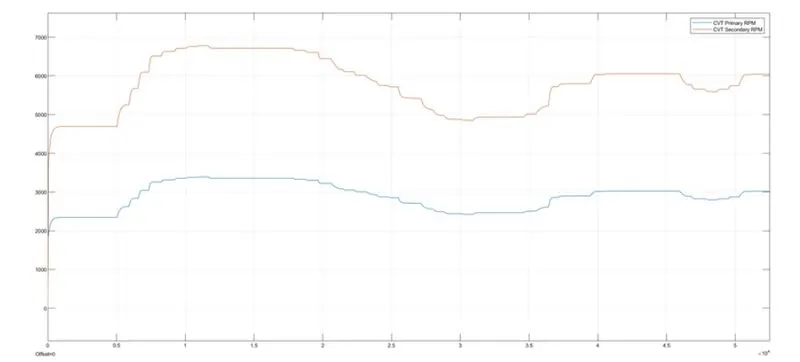
When there is an increase in throttle command there is an increase in the speed of the vehicle.This leads to decrease in CVT ratio compared to start where more torque is needed when there is braking forces at t=3,CVT -0.48 compared tp t=1,CVT-0.47.
Case 3- Simulation of BAJA ATV model with a lookup table- This difference of feedback.
A lookup table is an array of data that maps input values to output values.This is done so as to approximate a mathematical function. When a set of input values are known a lookup yield an output value corresponding to each input from a table of values.If the lookup table dose not explicitly define the input values,Simulink helps by estimating an outputvalue using interpolation,extrspolation,or rounding,where:
Interpolation is the process for estimating values that lie between known data points.
Extrapolation is the process for estimating values that lie beyond the range of known data points.
Rounding is process for approximating a value by alteringb its digits according to a known value.
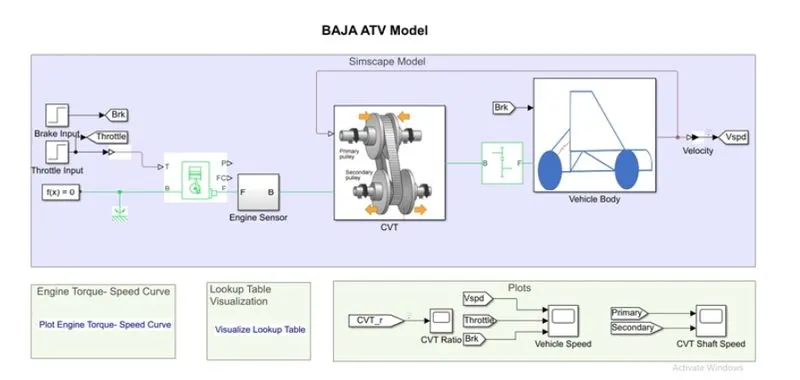
When compared to case 1 and cse 2 there exists a difference. The input to CVT is a lookup table which says for a particular CVT ratio what is the speed deliver.
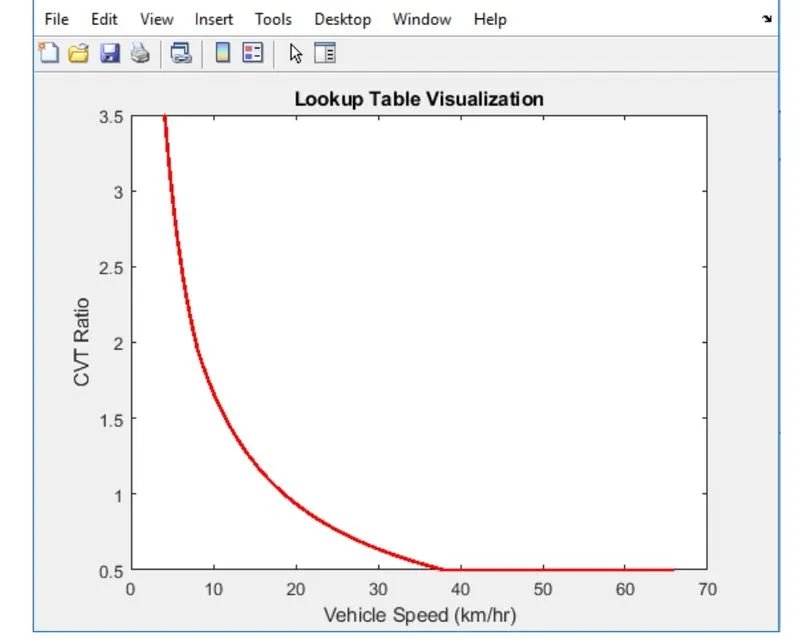
Apart from this the output speed is also tracked as fed to the primary pulley of CVT,thereby acting as feedback for effective refernce tracking.
Results and Observation for case 3.
a) Engine Torque Vs Speed:
b) CVT Ratio:
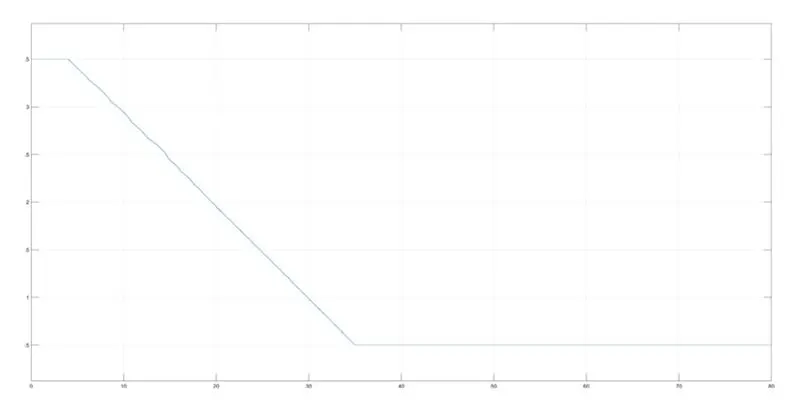
For starting the vehicle needs a high torque hence a higher value for CVT. The CVT ratio keeps decreasing.The lookup table has vehicle speed values.
Corresponding to a CVT ratio.For example i a lookup table at speed of 20km/hr, the CVT ratio is approx. equal to 1. Since there is reference tracking vehicle speed becommes 20km/hr at 30s.From the above graph at 30s,is 1.This is due to the presence of feedback.
c) Vehicle Speed Curve:
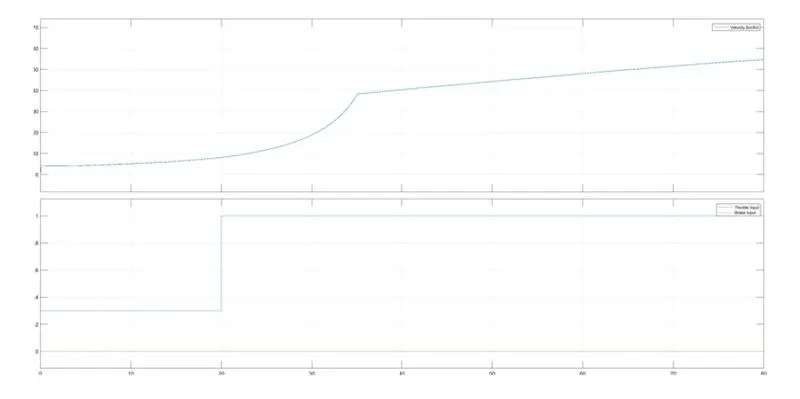
At t=35s the vehicle speed starts increasing hence there is a decrease in CVT ratio to obtain more rpm of the driven shaft decreases.
d) CVT Shaft Speed:
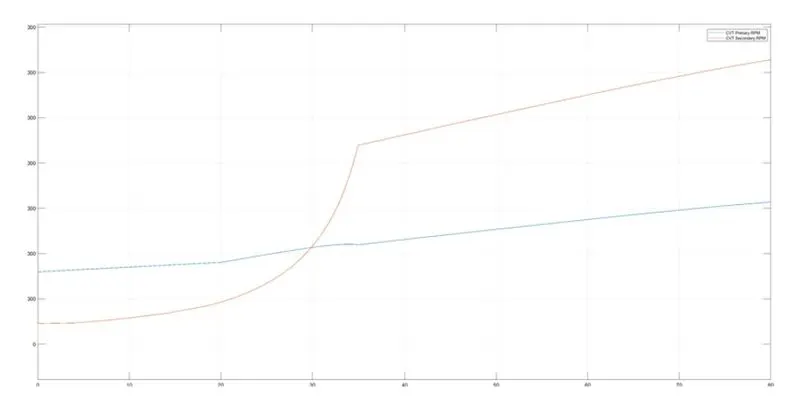
As speed increases secondary shaft speed increases leading to a lower CVT ratio as matching with the loopup table values.
Case 4: Simulation of BAJA ATV model with CVT and dashboard.
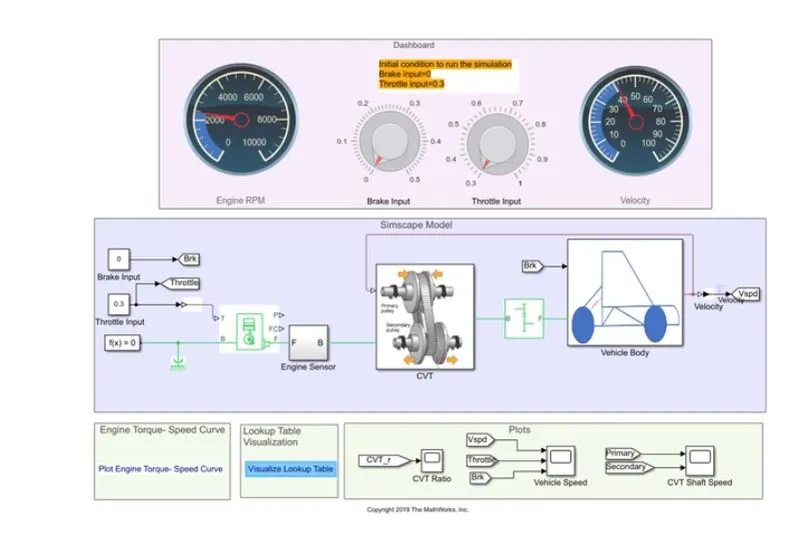
With help of knob, it is possible to control the throttle and brake inputs.
A lookup table is used to establish a releationship between vehicle speed and CVT.
The initial input value for the throttle is 0.3 but for the brake is 0.
Results and observations for case 4.
a) Engine Torque Vs Speed:
b) CVT Ratio:
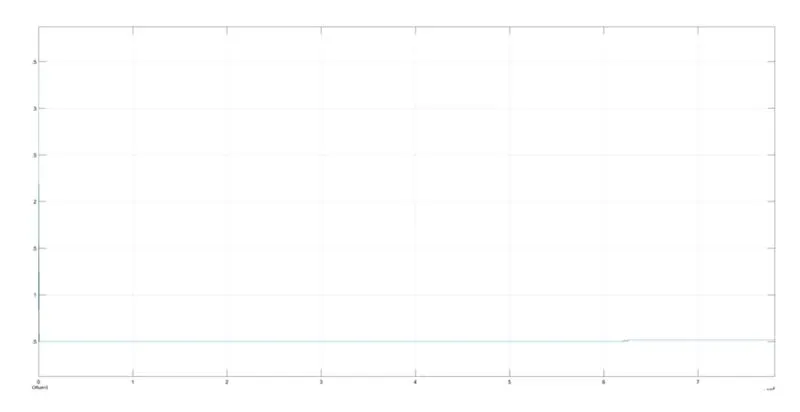
The input value of throttle is set as 0.3 so there is a gradual decline in CVT ratio but a steep fall at the start itself can be seen.
c) Vehicle Speed Curve:
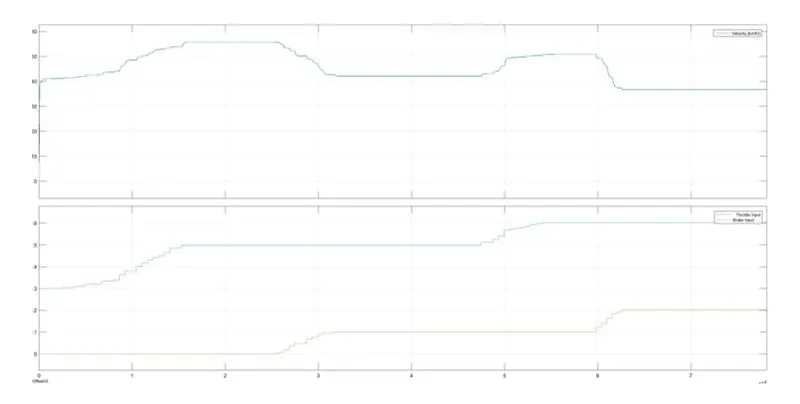
Whenever there is a fall in speed there is an increase in brake input.
d) CVT Shaft Speed:
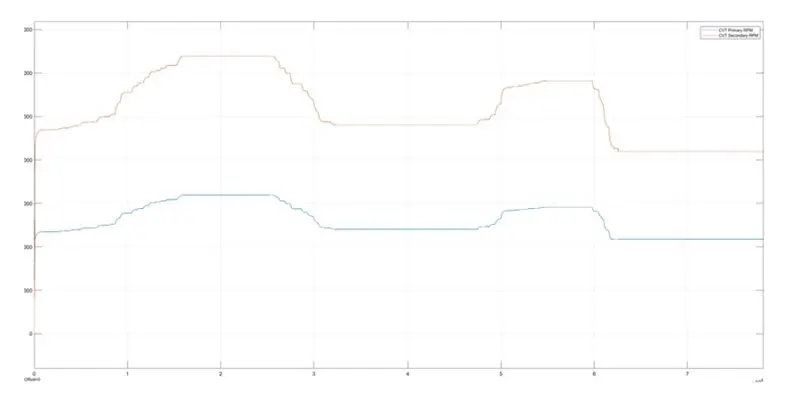
When throttle value increases speed value increases which is met by an increase in secondary rpm(rpm of the driven shaft) and during uniform speed,the CVT ratio doesn't change which can be seen via secondary and primary rpm remains constant during these periods.
-4. Learning Outcome:
- Undestanding the operation of a CVT drive system.
- Lookup table makes output curve smoother.If the lookup table doesn't explicity define the input values, Simulink helps by estimating an output value using interpolation,extrapolatio, or rounding giving better quality results.
- To achieve the desired output it is always good to use feedback.
- As a throttle input increases there happens an increase in speed but the CVT ratio falls when there is an increase in brake input the speed falls but there will be an increase in CVT ratio.