Project
AIM:
To prepare a technical report for BAJA All Terrain Vehicle model with and without using look up table.
OBJECTIVE:
To carry out the system level simulation of an BAJA All terrain vehicle and prepare the technical report explaining the model properties of with and without using look up table and comment the results.
EXPLANATION:
BAJA ALL TERRAIN VEHICLE MODEL:
All terrain vehicles are among the most useful land vehicles ever invented. Designed to combat the hazards of different kinds of terrain, they can be used in almost every worksite. Not only they make travelling easier for drivers, they are also safe to use when transporting loads or cargo. Suspension and chasis play a vital role in the structural performance of an off-road vehicle.
COMPONENTS OF A BAJA ALL TERRAIN VEHICLE:
The main components are used in BAJA All terrain vehicle are given below:
1. Vehicle Body
2. Suspension
3. Tyre
4. Engine
5. Continuously Variable Transmission (CVT)
CONTINUOUSLY VARIABLE TRANSMISSION (CVT):
A CVT is also known as a shiftless transmission, stepless transmission, pulley transmission or in case of motorcycles, a twist and go, is an automatic transmission that can change seamlessly through a continuous range of effective gear ratios. This contrasts with other mechanical transmissions that offer a fixed number of gear ratios. The flexibility of a CVT with suitable control may allow the input shaft to maintain a constant angular velocity even as the output speed varies.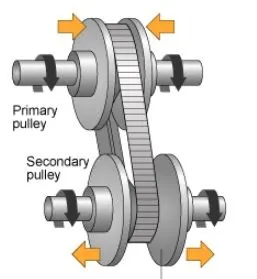
STUDY - 1:
CASE - 1:
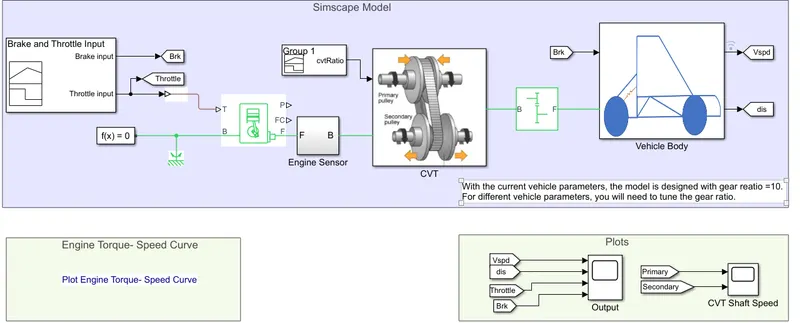
SIMULINK MODEL FOR BAJA ALL TERRAIN VEHICLE WITH CVT:
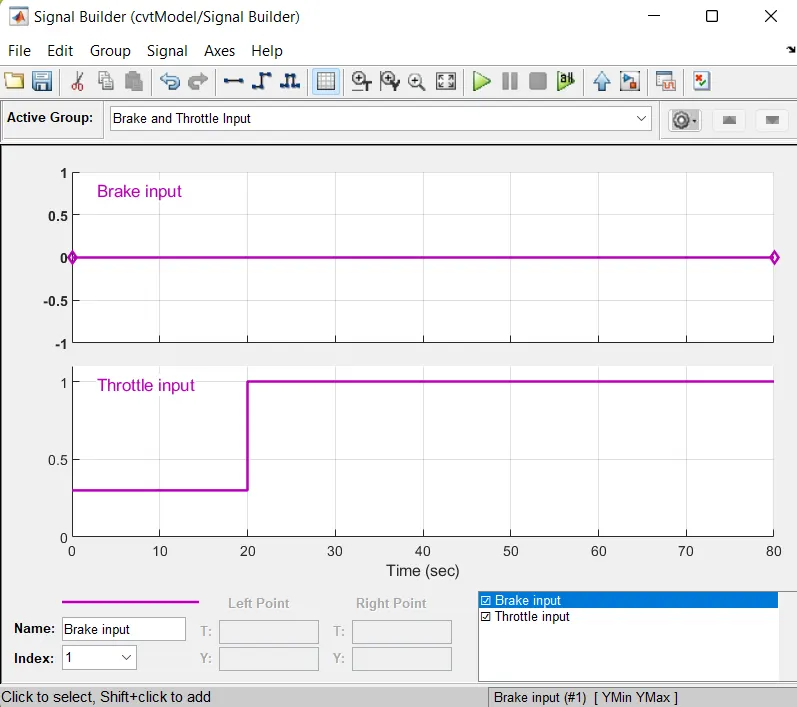
Signal Builder:
Signal Builder is used for giving input values of Brake input and Throttle input and it is connected with Generic Engine Block.
where,
Brake input=0,
Throttle input= 0.3 for first 20 sec, after 20sec throttle input value becomes 1.
Generic Engine:
Represents a system level model of spark-ignition and diesel engines suitable for use at initial stages of modeling when only the basic parameters are available. Optional idle speed and red line controllers are included.
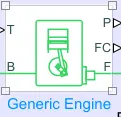
Connections F and B are mechanical rotational conserving ports associated with the engine crankshaft and engine block, respectively. Connections P and FC are physical signal output ports through which engine power and fuel consumption rate are reported.
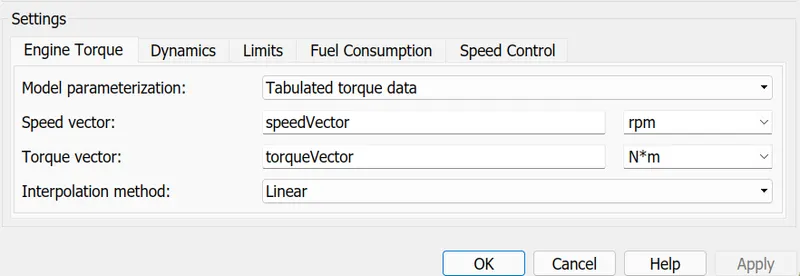
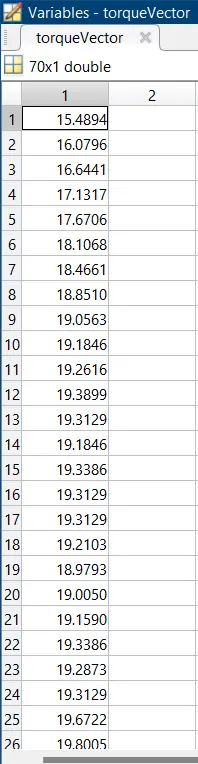
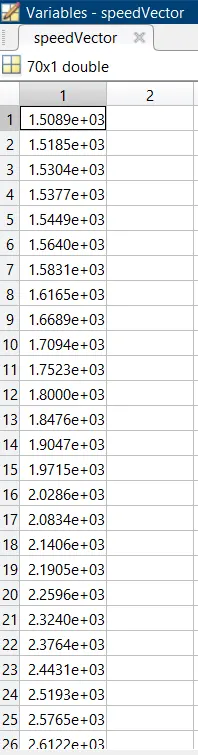
Torque Vector and Speed Vector value is already assigned in the MATLAB program in a array dats set.
Engine Sensor:
Engine Sensor is connected with Generic Engine. Engine sensor contains ideal mechanical rotational sensor that converts variable measured between two mechanical rotational nodes into a control signal proportional to angular velocity or angle.
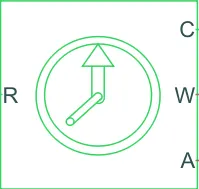 ideal rotational motion sensor
Connections R and C are mechanical rotational conserving ports and connections W and A are physical signal output ports for velocity and angular displacement, respectively.
Simple Gear:
Engine is connected to CVT with simple gear ratio for speed reduction.
Continuously Variable Transmission:
The main components of CVT is given below:
- Primary Pulley
-Secondary Pulley
-Variator
-Belt
Note-1: If variator of primary pulley goes outward and secondary pulley goes inward it will leads to speed reduction.
Rp<Rs
Note-2: If variator of primary pulley goes inward and secondary pulley goes outward it will leads to overdrive.
Rp>Rs
CVT Ratio:
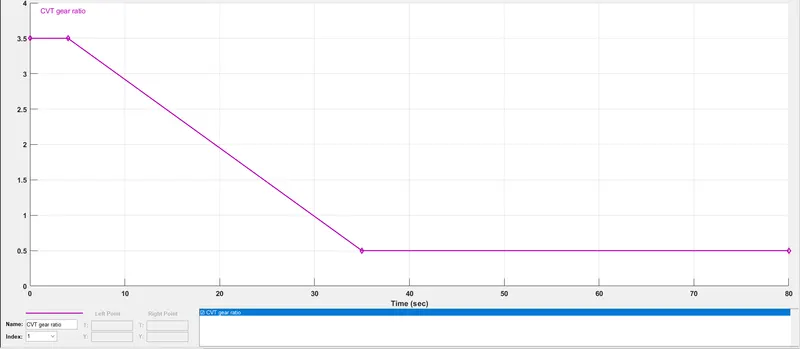
CVT Ratio block is connected with CVT by giving random ratio values to get the value of velocity for those random CVT ratio.
Vehicle Body:
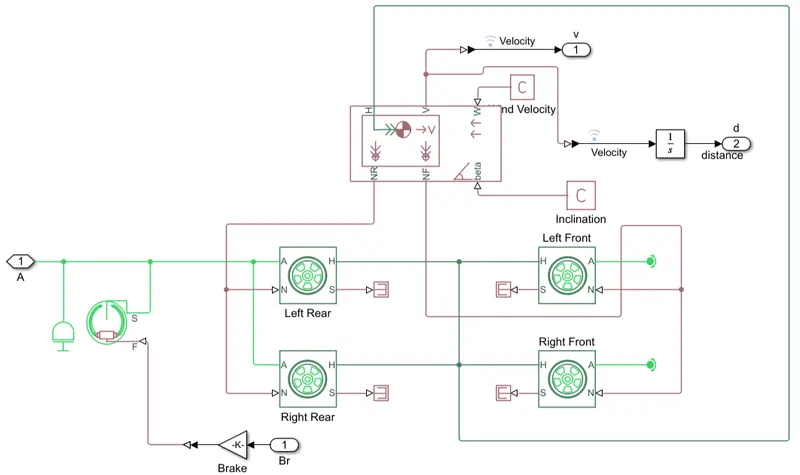
Represents a two-axle vehicle body in longitudinal motion. The block accounts for body mass, aerodynamic drag, road incline and weight distribution between axles due to acceleration and road profile. The vehicle can have the same or a different number of wheels on each axle. Optionally include pitch and suspension dynamics or additional variable mass and inertia. The vehicle does not move vertically relative to the ground.
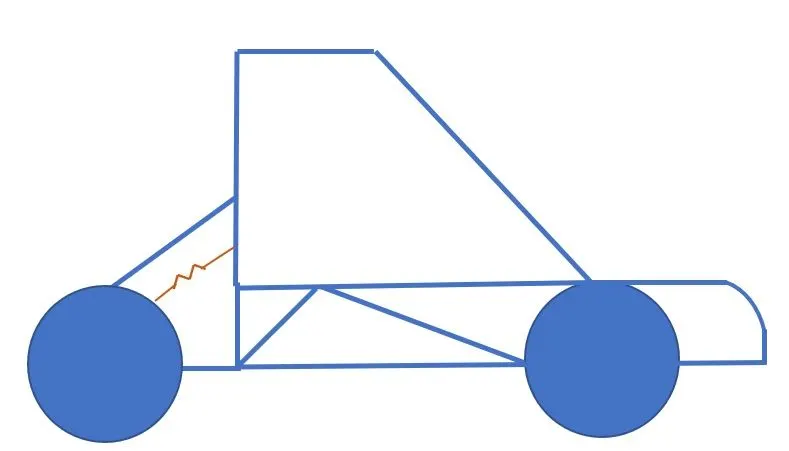
Vehicle Body contains 2 front wheel and 2 rear wheel which is connected with inertia output shaft and double shoe brake.
CASE - 2:
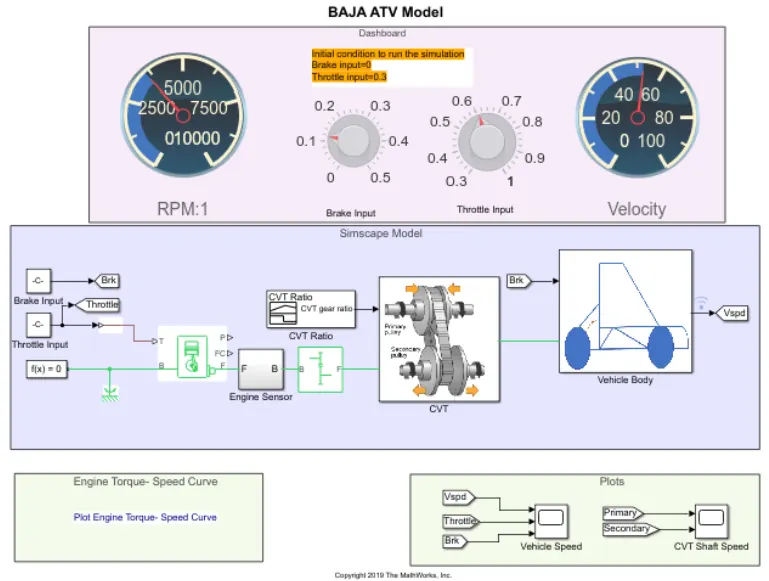
SIMULINK MODEL FOR BAJA ALL TERRAIN VEHICLE WITH CVT USING DASHBOARD:
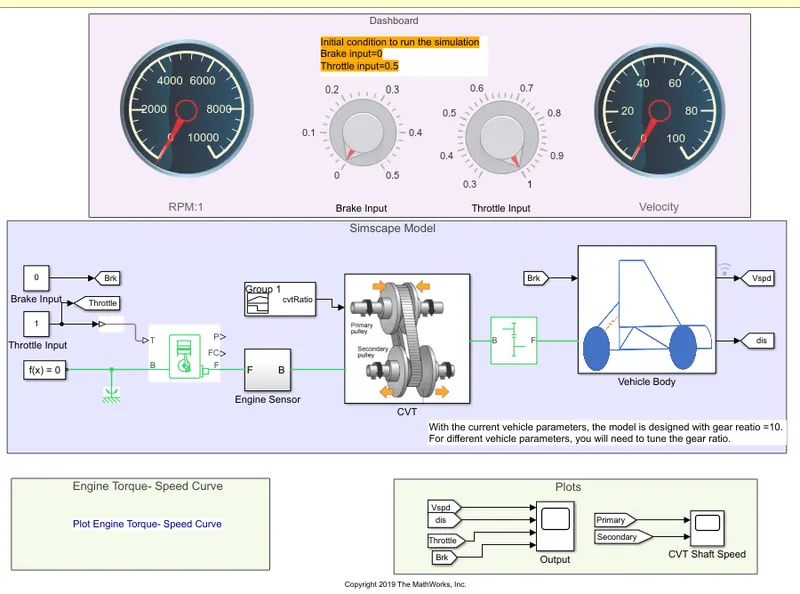
In the above simulink model, RPM(speed) gauge, brake input gauge, throttle input gauge and velocity gauge is connected in the dashboard. Brake input is 0, throttle input is 0.3 for initial condition to run the simulation.
Dashboard is connected with BAJA all terrain vehicle using CVT in simulink model and with the help of dashboard, varaition of speed and velocity will display in the RPM:1 gauge and velocity guage, while running the simulation.
RPM gauge refers the speed of the primary and secondary pulley and velocity gauge refers the speed of the vehicle.
STUDY-2:
CASE-1:
SIMULINK MODEL FOR BAJA ALL TERRAIN VEHICLE WITH CVT (USING LOOK UP TABLE):
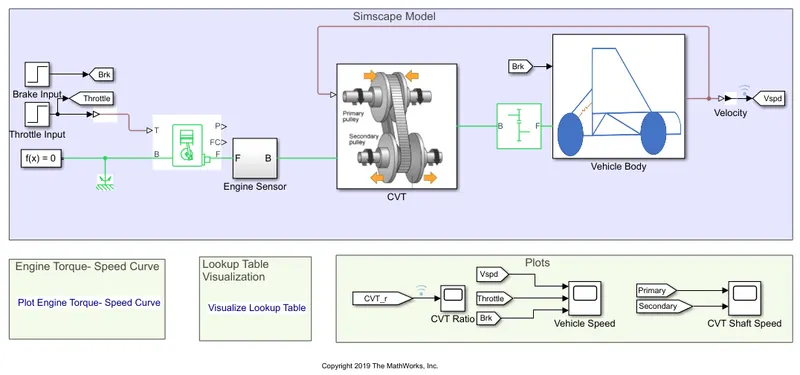
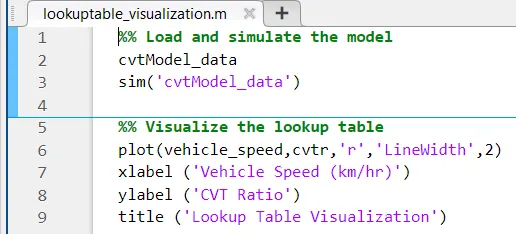
In the above model look up table data has been assigned as input to the CVT instead of giving cvt ratio. For giving input of look up table by creating a program in the MATLAB and data has been assigned as input to the CVT.
Look Up Table Program in MATLAB:
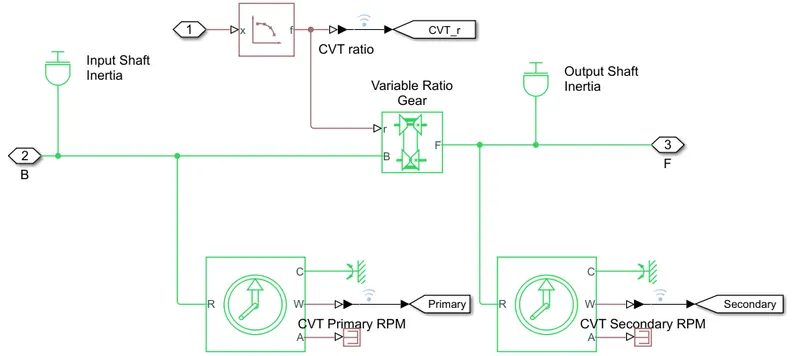
GIVING INPUT TO CVT USING LOOK UP TABLE:
After creating look up table data, give the data as input to the CVT.
CASE-2:
SIMULINK MODEL FOR BAJA ALL TERRAIN VEHICLE WITH CVT USING DASHBOARD (USING LOOK UP TABLE):
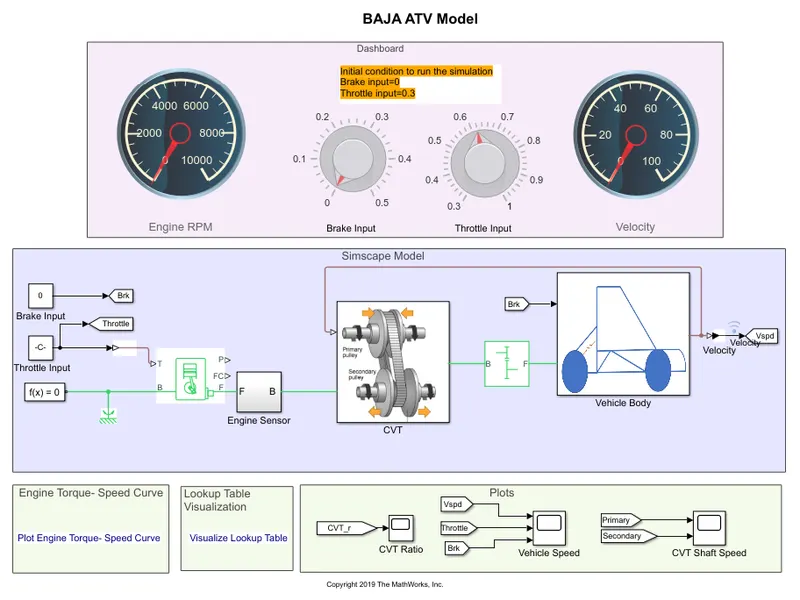
In the above model, RPM gauge, brake input gauge, throttle input gauge and velocity gauge is connected in the dashboard. Brake input is 0, Throttle input is 0.3 for initial condition to run the simulation.
In the above model Look up table data has been assigned as input to the CVT instead of giving CVT ratio and for giving input of look up table by creating a program in the MATLAB and data has been assigned as input to the CVT.
RESULT:
STUDY-1:
CASE-1:
PLOT ENGINE TORQUE - SPEED CURVE:
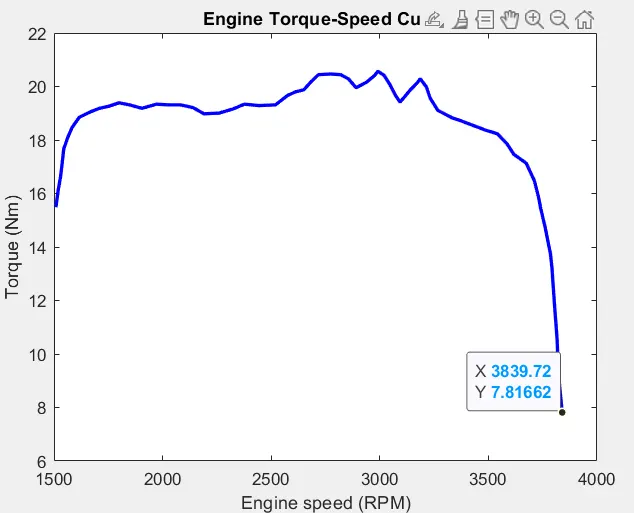
In the above plot maximun velocity reaches at 3840 RPM. Vehicle speed depends on CVT ratio.
VEHICLE SPEED PLOT:
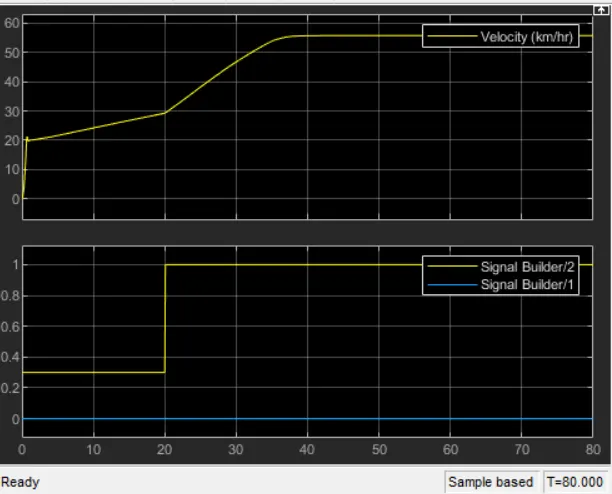
In the above plot, brake input is 0 and throttle input is 0.3 for 20sec for which velocity will reach 20 and by increasing the throttle input value to 1, then velocity value will increase and it reaches the maximum velocity.
CVT SHAFT SPEED PLOT:
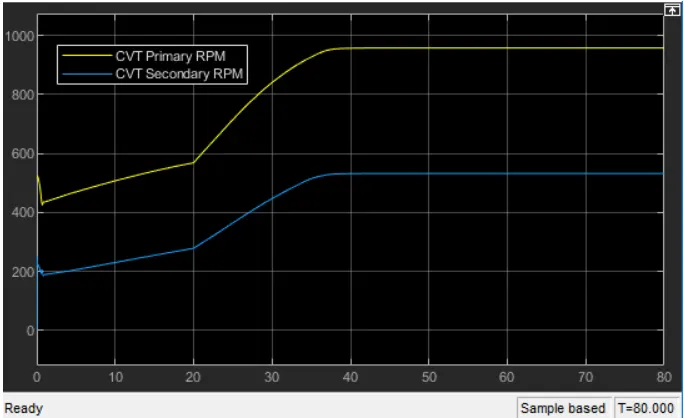
In continuously variable transmission(CVT) variator of primary pulley goes inward and secondary pulley goes outward it will leads to overdrive. Primary pulley radius increases and secondary pulley radius decreases. So speed of primary pulley is greater than secondary pulley.
Rp>Rs
ENGINE SPEED:
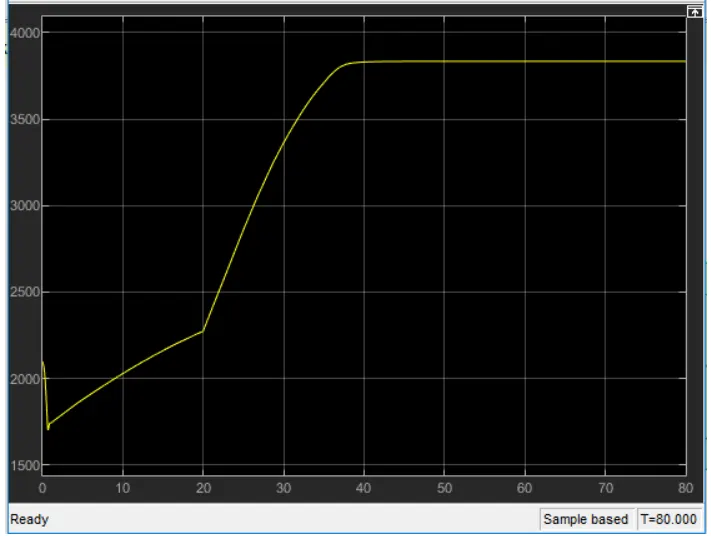
In the above plot, brake input is 0 and throttle input is 0.3 for 20sec, engine speed will decrease at the begining because of increasing gear ratio which inceases the torque and by increasing the throttle input value to 1, then engine speed value will increase and it reaches the maximum speed.
CASE-2:
In initial condition RPM:1 gauge shows 0 RPM and velocity gauge shows 0km/hr.
Giving time value as "inf" and run the simulation. While simulation is running,throttle input value & brake input value can change in throttle input gauge & brake input gauge in the dashboard and will analyse the variation of RPM and velocity in the RPM gauge and velocity gauge.
VEHICLE SPEED PLOT:
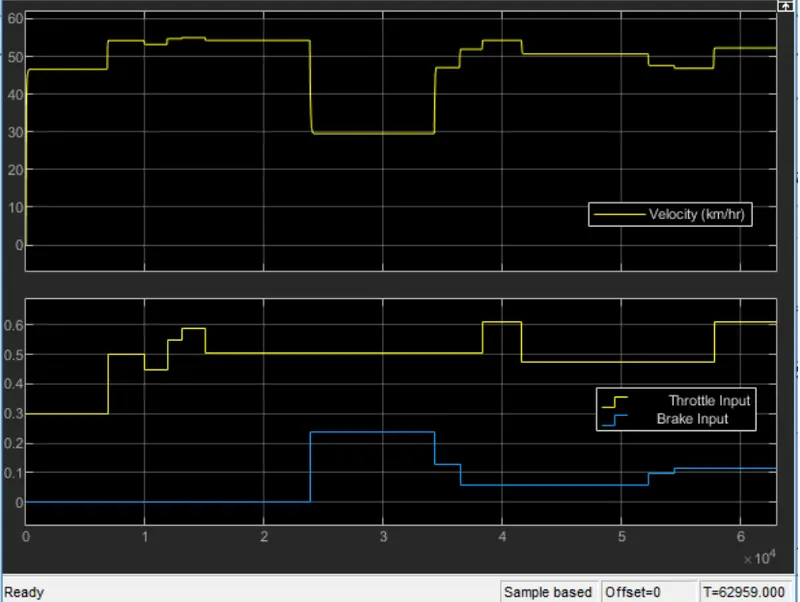
From the above vehicle speed plot, observed that by increasing the throttle input value, it will increase the velocity and by increasing the brake input value it will decrease the velocity.
CVT SHAFT SPEED PLOT:
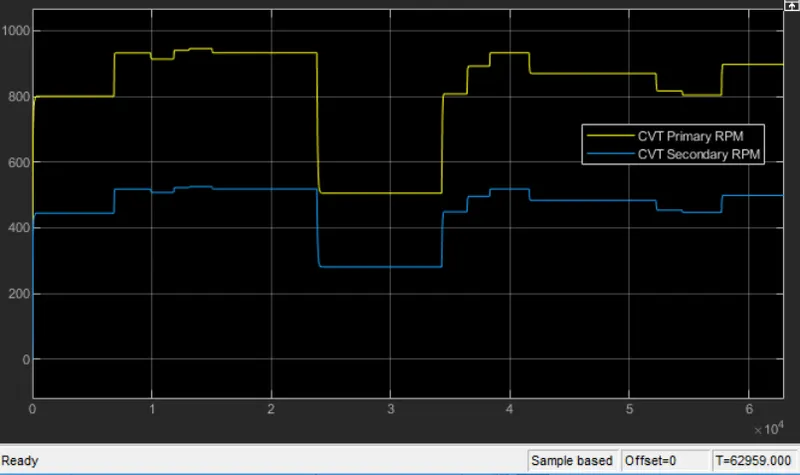
From the above plot, observed that by increasing the throttle input value, it will increase the RPM of the primary & secondary pulley and by increasing the brake input value it will decrease the RPM of primary & secondary pulley.
ENGINE SPEED:
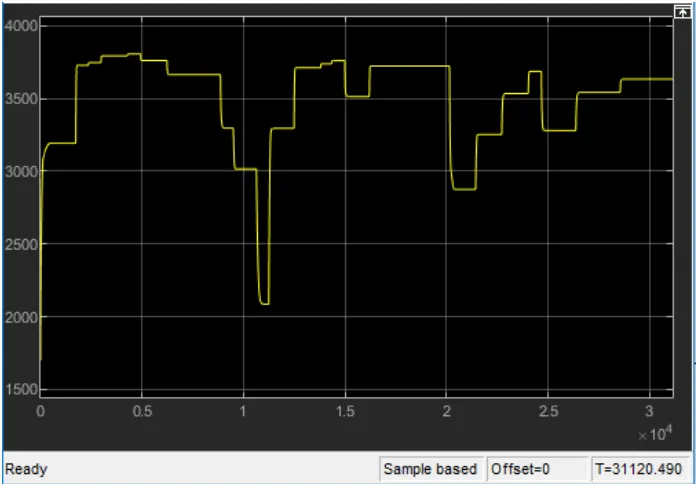
From the above plot, observed that by increasing the throttle input value, it will increase the engine speed and by increasing the brake input value it will decrease the engine speed.
STUDY-2:
CASE-1:
LOOK UP TABLE VISUALIZATION PLOT:
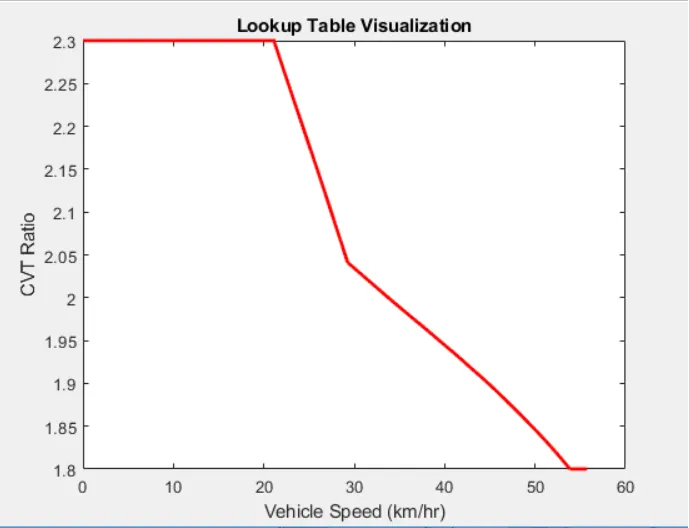
CVT RATIO PLOT (LOOK UP TABLE DATA):
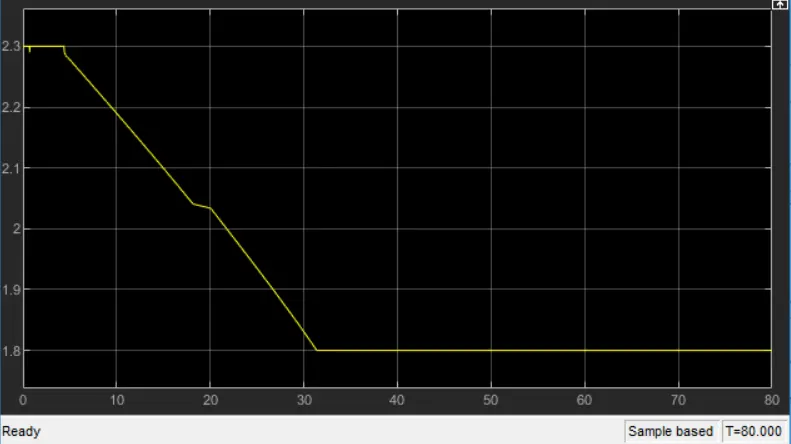
The above plot shows the value of look up table input data given to the CVT.
VEHICLE SPEED PLOT:
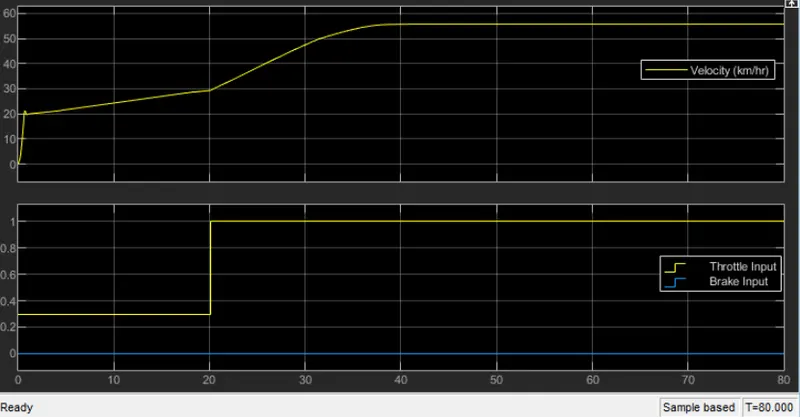
In the above plot, brake input is 0 and throttle input is 0.3 for 20 sec velocity will reach 20 and by increasing the throttle input value to 1, then velocity value will increase and it reaches the maximum velocity.
CVT SHAFT SPEED PLOT:
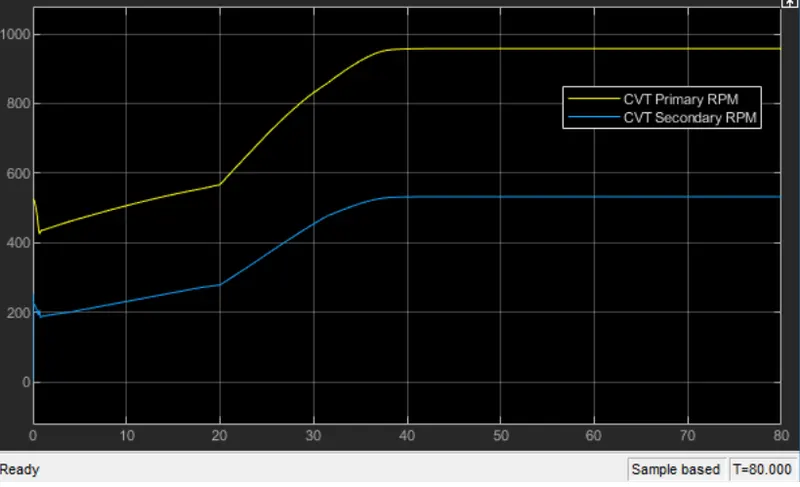
In continuously variable transimission(CVT) variator of primary pulley goes inward and secondary pulley goes outward it will leads to overdrive. Primary pulley radius increases and secondary pulley radius decreases. So speed of primary pulley is greater than secondary pulley.
Rp>Rs
ENGINE SPEED:
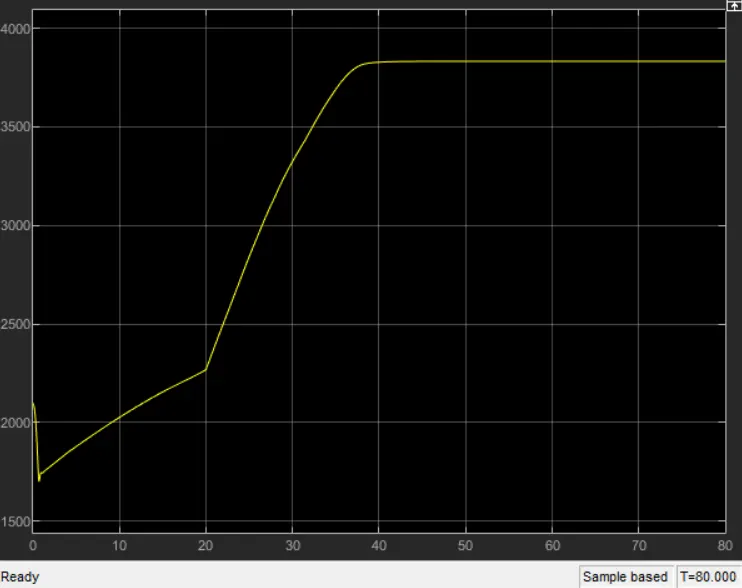
In the above plot, brake input is 0 and throttle input is 0.3 for 20 sec, engine speed will decrease at the begining because of increasing gear ratio which which increases the torque and by increasing the throttle input value to 1, then engine speed value will increase and it reaches the maximum speed.
CASE-2:
CVT RATIO PLOT (LOOK UP TABLE DATA):
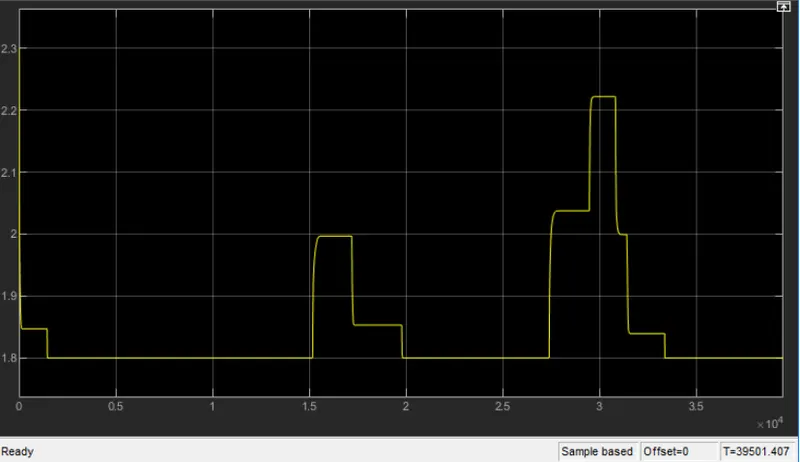
In the above plot, CVT ratio will vary by changing the throttle gauge. If throttle value increases CVT ratio decreases. If throttle value decreases CVT ratio increses.
VEHICLE SPEED PLOT:
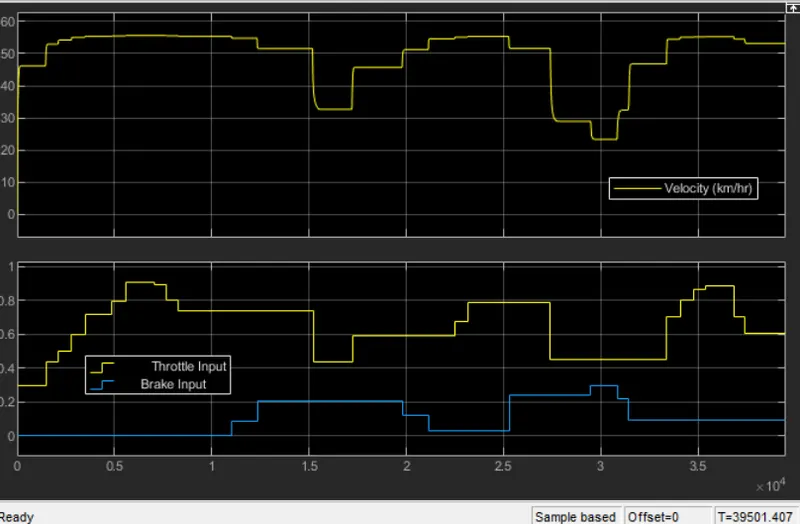
From the above vehicle speed plot, observed that by increasing the throttle input value, it will increase the velocity and by increasing the brake input value it will decrease the velocity.
CVT SHAFT SPEED PLOT:
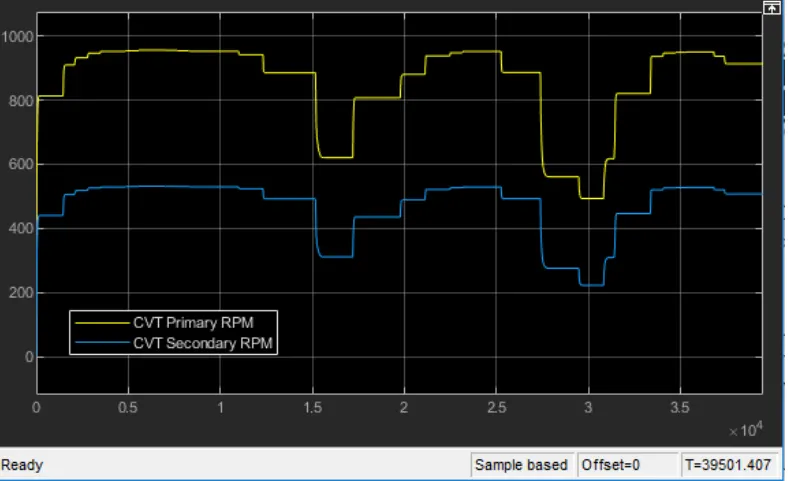
From the above CVT shaft speed plot, observed that by increasing the throttle input value, it will increase the RPM of the primary & secondary pulley and by increasing the brake input value it will decrease the RPM of the primary & secondary pulley.
ENGINE SPEED PLOT:
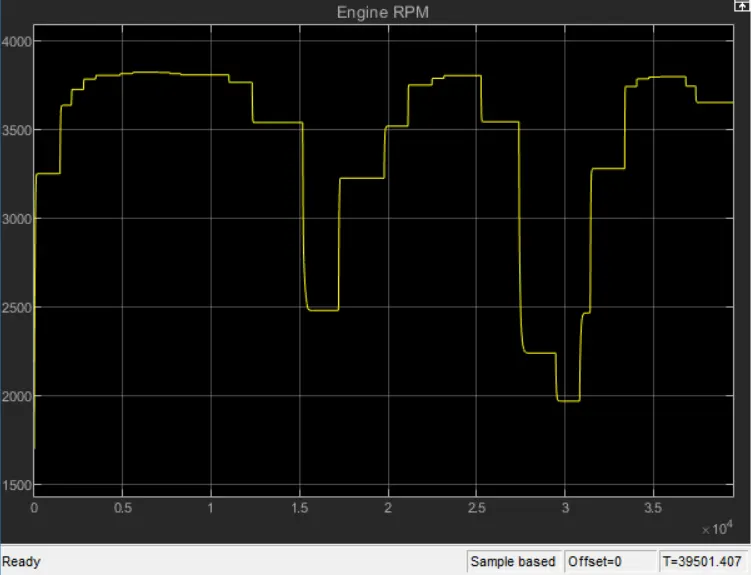
From the above engine speed plot, observed that by increasing the throttle input value, it will increase the engine speed and by increasing the brake input value it will decrease the engine speed.
CONCLUSION:
System level simulation of an BAJA all terrain vehicle with and without using look up table has been carried out and technical report for the model has been prepared and output results are plotted.