Project
system-level simulation of an all-terrain vehicle
objective : writing a technical report explaining the model properties & comments on the results after simulation of model.
all-terrian vehical: a small open motor vehicle with one seat and three or more wheels fitted with large tyres, designed for use on rough ground.
we use cvt model for this all-terrain vehicle so we need to more about the model.
simulink model of cvt(continous variable transmission):
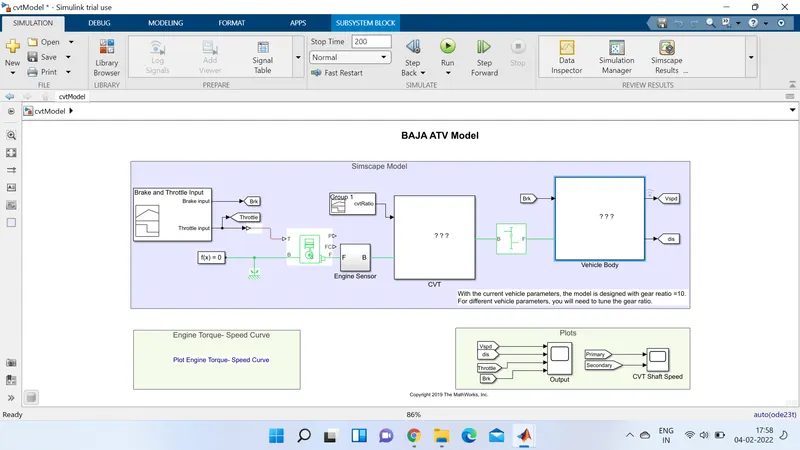
main blocks in the above model is
1.engine sensor
2.generic engine
3.cvt
4.gear
5.vehical body
6.we give input brake and throttle as shown in figure
so we will look into each block now.
generic engine :
the block model is shown below.
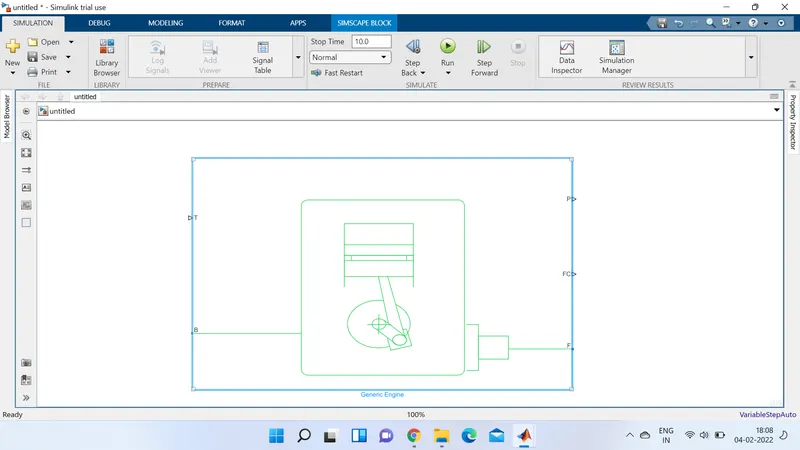
Represents a system-level model of spark-ignition and diesel engines suitable for use at initial stages of modeling when only the basic parameters are available.
Connections F and B are mechanical rotational conserving ports associated with the engine crankshaft and engine block, respectively. Connections P and FC are physical signal output ports through which engine power and fuel consumption rate are reported.
engine sensor :
in the above sensor is connected to engine and cvt . the sensor mainly used to give rpm output to the cvt.
cvt(contionous variable transmission)
cvt is a subsystem which contains following blocks.
input and output inertia
variable gear ratio
ideal rotational motion sensors 1 and 2:these both gives primary and secondary rpm as output.
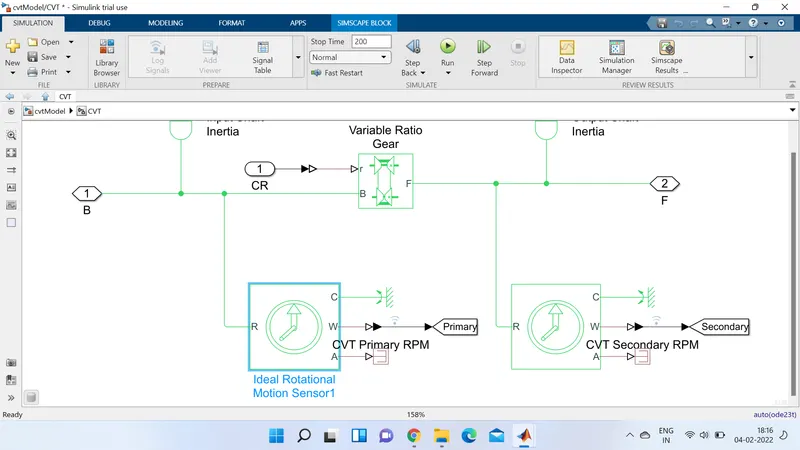
cvt and vehical body is connnected by simple gear.
vehical body :
this block is subsystem which consists four tires as front, rear this connected to vehical body block
which gives velocity as output in km/hr.
when velocity is integrated with intergrator block we get distance as next output.
these are main components in all terrian vehicle.
now we run the simulink and observe the results for the vehicle.
first we give input break and throtlle as constant like in the following picture.and results is shown in the image too after we see the image we elaboarte on results.
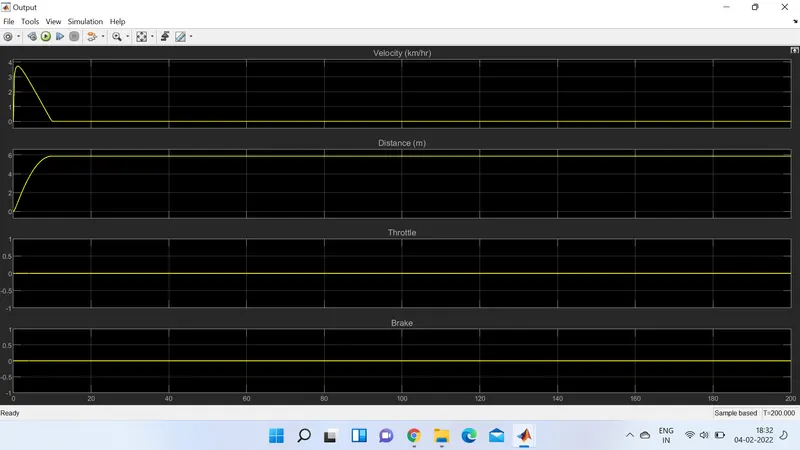
we can see in the image that break and throttle are at o through out and we can observe that when velocity hit certain point it statred decreasing becuase it is its final high value given.in distance graph it takes some time to reach 0 at 10 sec after that it maintain same.
now lets see the primary and secondary rpm scope.
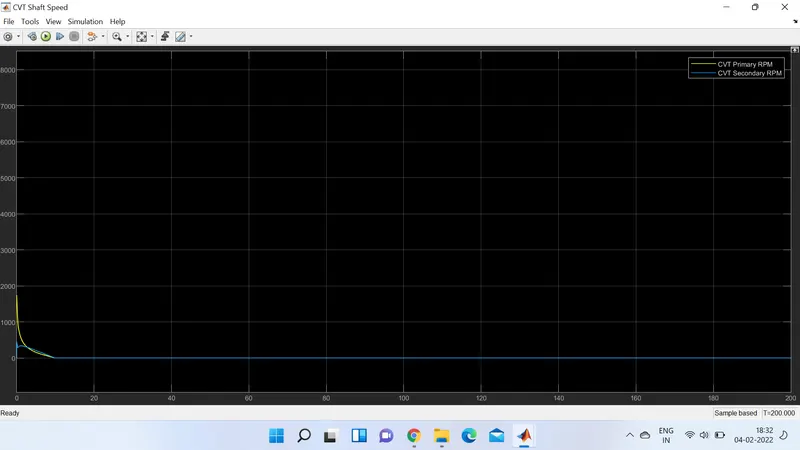
we can see yellow as primary and blue as secondary the primary started from high and decreases and becomes zero at 10sec same as secondary but rpm of secondary is quite low.
now lets chnage the input break and throtle :
in this below image we give throttle at 20 seconds soo lets see the image and discuss .
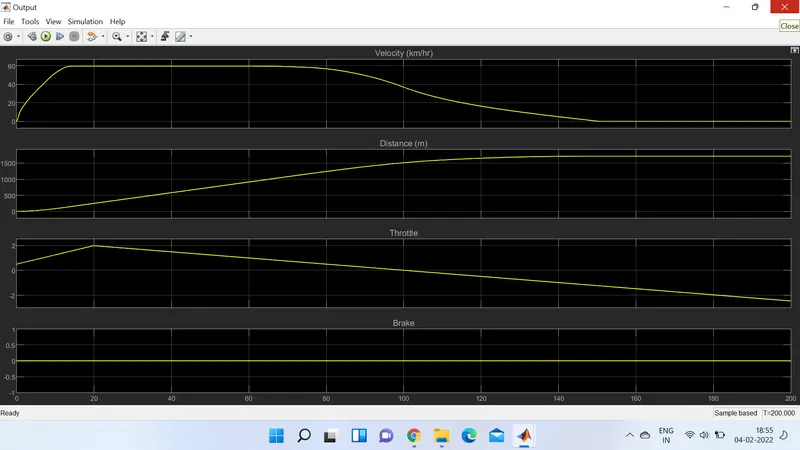
in above image velocity dropped after hitting a certain point but after we change the throttle value the velocity value keeps at same value until sometime and drops after a sometime to 0
distance also diffrent from original result after chnaging. lets see the rpm values too.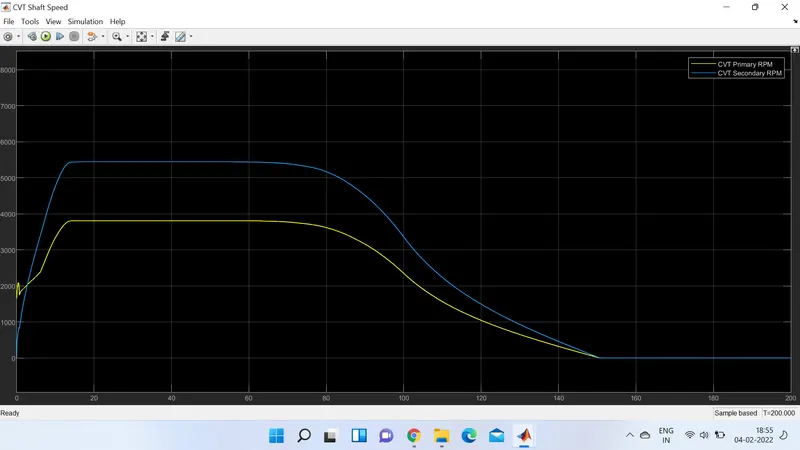
when break and throttle at 0 the secondary is low but when we increase throttle the secondary increasing so high higher than primary rpm.
we chnage the rpm using blocks given below.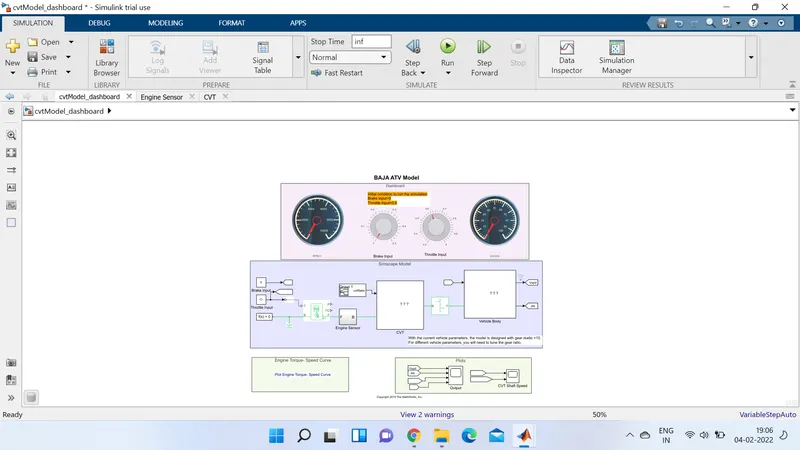
soo this is the detailed report and understanding of results of all-terrain vehical .