Project
Technical report :
Aim:
To prepare a technical report after simulation simulink model of ATV vehicle.
Working of a CVT:
The CVT is based out of 2 varying diameter pulleys. These pulleys are namely Primary and Secondary pulleys.
Primary pulley - This is the driving pulley which is connected to the engine output shaft.
Secondary pulley - This is the driven pulley which is transmission output shaft that drives the wheels.
The two pulleys are having continuously varying effective diameter and each pulley consists of fixed and movable disc as shown in the figure.
The movement of the movable disc is governed by the inputs provided by the speed , engine RPM & load sensors which are inturn converted to hydralic outputs to move the movable disc of the primary pulley and the same is mimiced in the opposite way by movable disc of secondary pulley so that the belt wont slip. In this way we acheive infinite number of gear ratios within a fixed range.
The pulleys are connected by a steel belt which has been constantly improved over the years to increase the durability.
CVT Ratio is approximated as = (The effective diameter of primary pulley)/(The effective diameter of secondary pulley)
The smaller the ratio the higher the gear and speed of the vehicle and vice-versa.
Major Components/Blocks of the simulink model:
- Brake and throttle inputs
- Generic engine - whose speed and torque are provided using a 2d plot in every model.
- CVT subsystem - CVTr ratio is provided in different ways (using signal builder, 1D lookup table) , Primary and Secondary RPM are logged out of this subsystem using a ideal rotational motion sensor.
- Simple Gear - a gear ratio of 10(provided in the model).
- A vehicle Body subsytem - the parameters of normal force on wheels, braking , vehicle inclination , wind velocity are set here to simulate the conditions. The output velocity of the vehicle is logged out of the subsytem.
Given Simulink models:
The given simulink models are all related to simulation of ATV vehicle used in BAAJA competitions.
The following are the various simulink models that are provided, each simulink is one and same with minor changes such as how the data of CVT ratio is provided to the CVT , different usage of blocks to log the required data.
The changes made in each model are mentioned as follows:
| S.no | Simulink model | Description(if any) | Input of CVTr data | Data studied | Conclusion |
| 1. | cvtModel and cvtModel_dashboard | Both the models are exactly the same even in terms of data studied , the difference that exists is a dashboard is added to visualize the results in the latter one. | Signal builder | The vehicle speed and distance travelled are visulaized for various throttle and braking values | |
| 2. | cvtModel_data | This model is same as the cvtModel (mentioned above) , the difference is that the data of CVTr to the vehicle speed is mapped back to the workspace | Signal Builder | Same as the cvtModel with an addition of plot between CVTr and Vehicle speed | |
| 3. | cvtModel_mapped & cvtModel_dashboard_mapped | Both the models are exactly the same even in terms of data studied , the difference that there exists a dashboard which is added to provide values of throttle and brake and to visualize the results in the latter one. The CVTr ratio is provided using 1d lookup table. |
1D lookup table. with CVTr in reference to vehicle speed through a feedback loop. | Vehicle speed and the comparison between the RPM of the input and output disc of CVT. | |
| 4. | cvtModel_cvtratio_rpm | In this model the CVTr is provided using a lookup table which is based on CVTr-engineRPM. | 1D lookup table with CVTr reference to Engine RPM | Vehicle speed and the comparison between the RPM of the input and output disc of CVT. |
1. cvtModel:
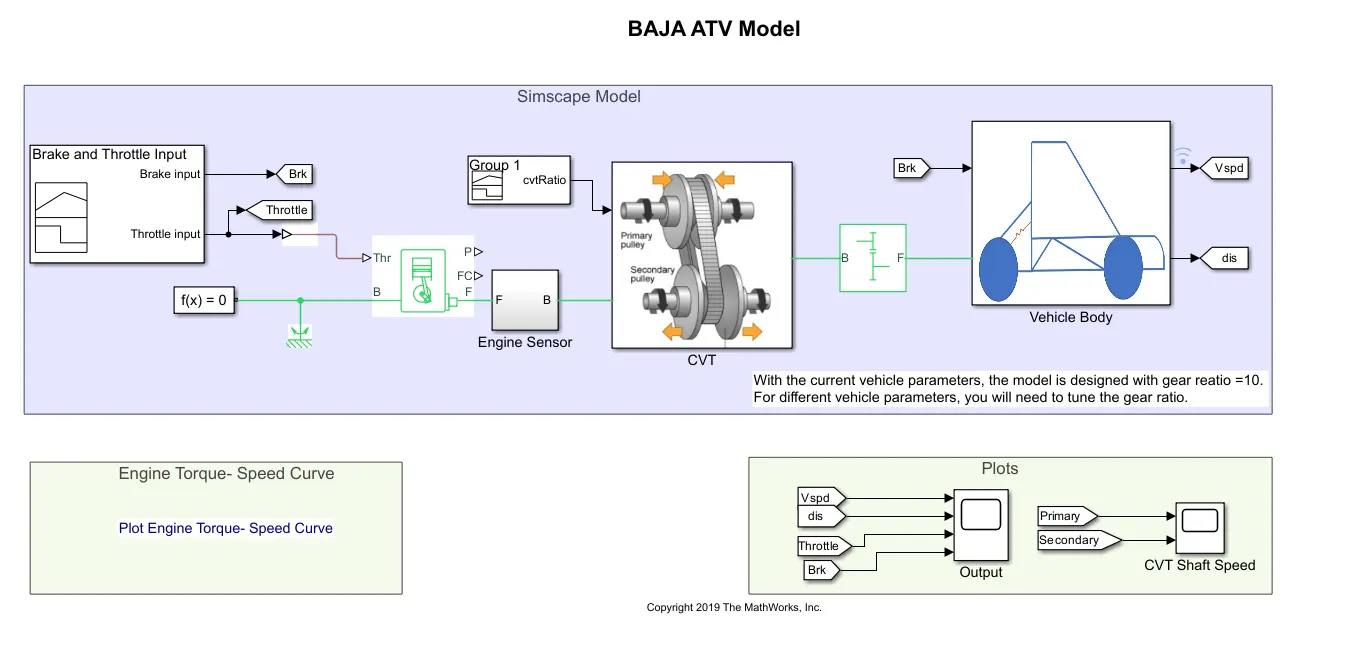
Output:
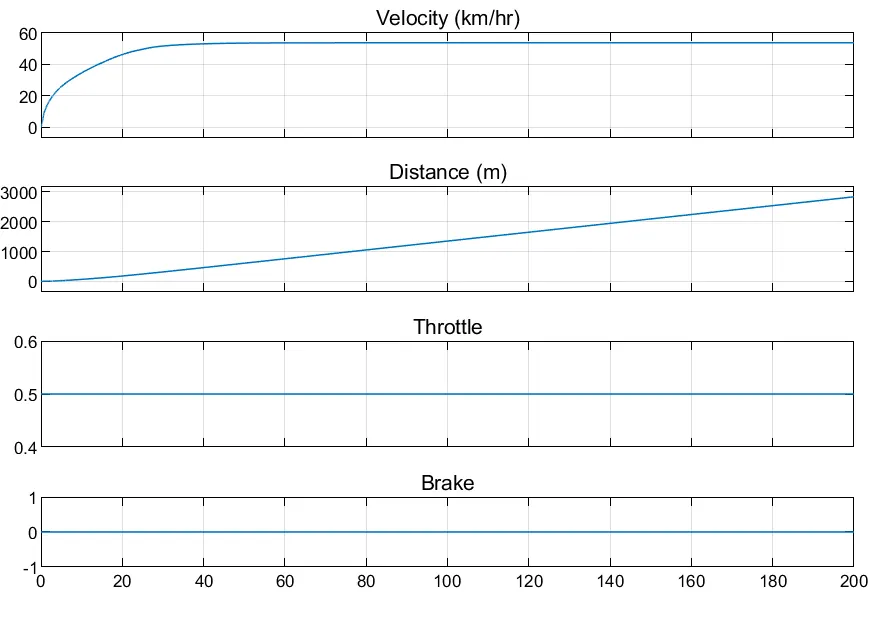
Observation:
| Throttle value | 0.5 |
| brake value | 0 |
The vehicle reached to the maximum speed gradually for the given throttle value and stayed constant as there was no change in the braking value.
2. cvtModel_dashboard
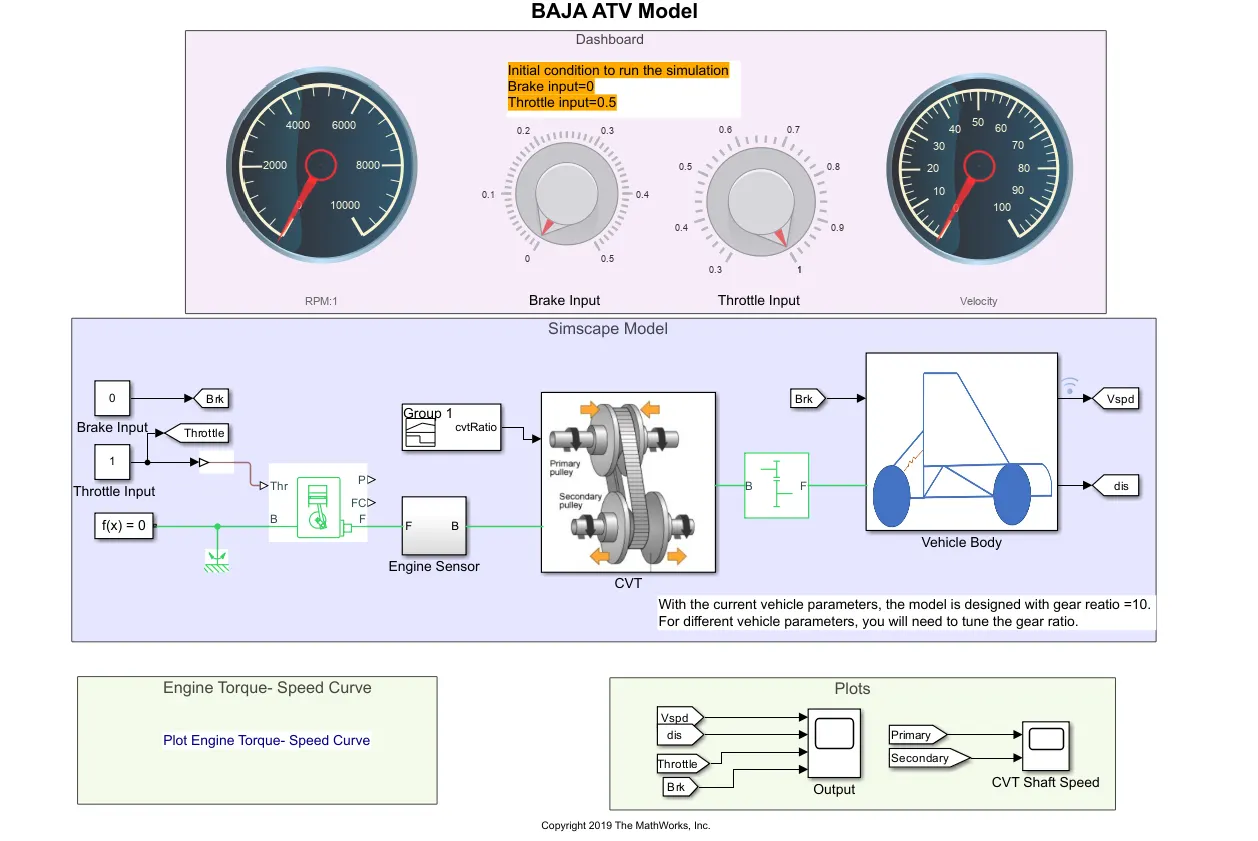
Throttle and brake values can be changed realtime and the Velocity and Primary RPM(RPM of input plate of CVT) can be visualized.
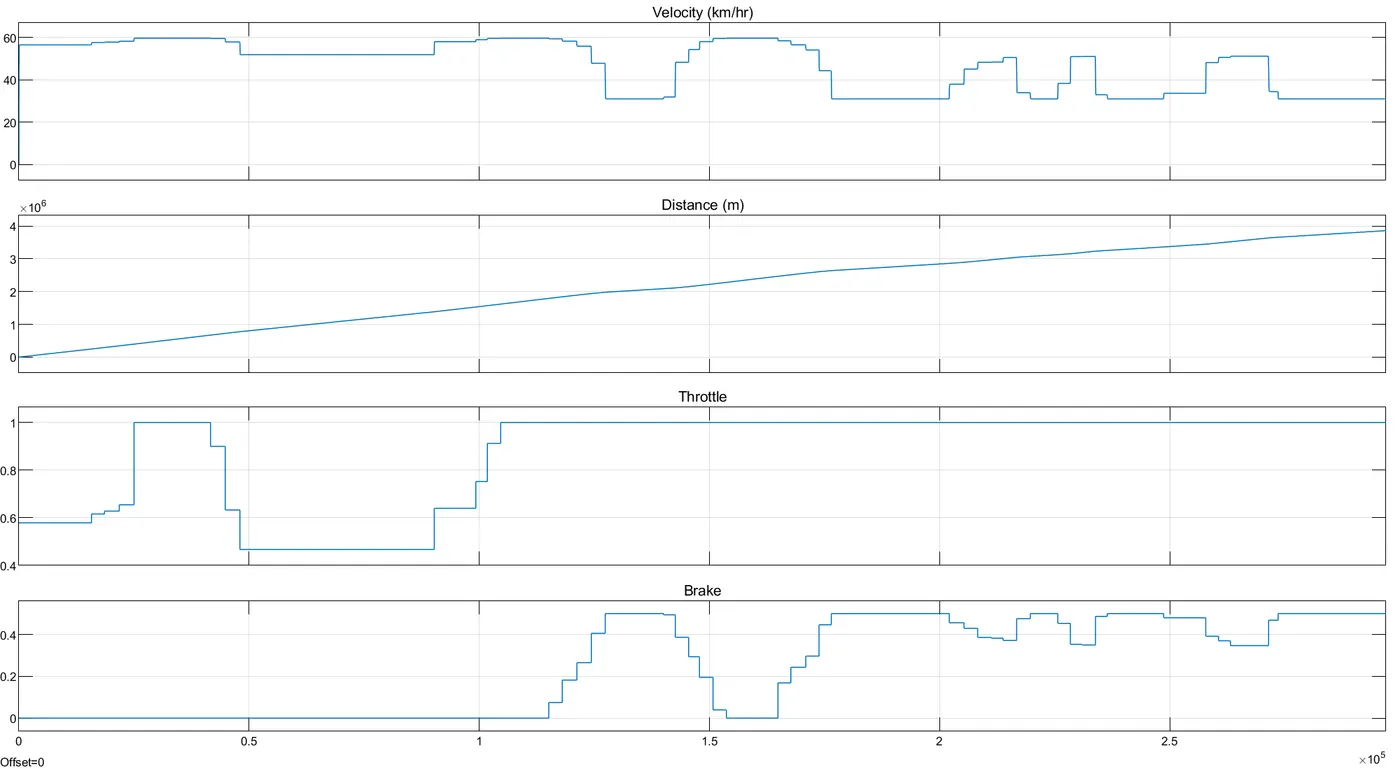
Velocity , throttle , brake and distance values
CVT primary RPM and Secondary RPM:
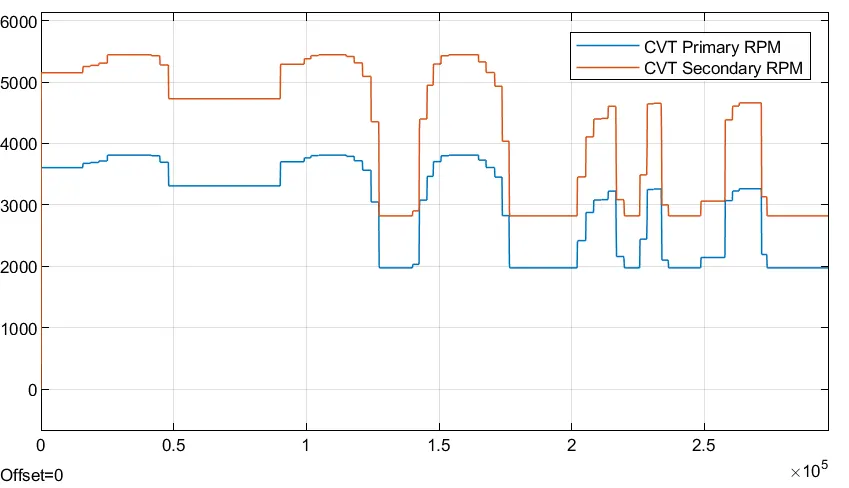
Observation :
The velocity increases as the throttle increases and when braking is constant and the velocity decreases with increase in braking when throttle remains constant.
3. cvtModel_data
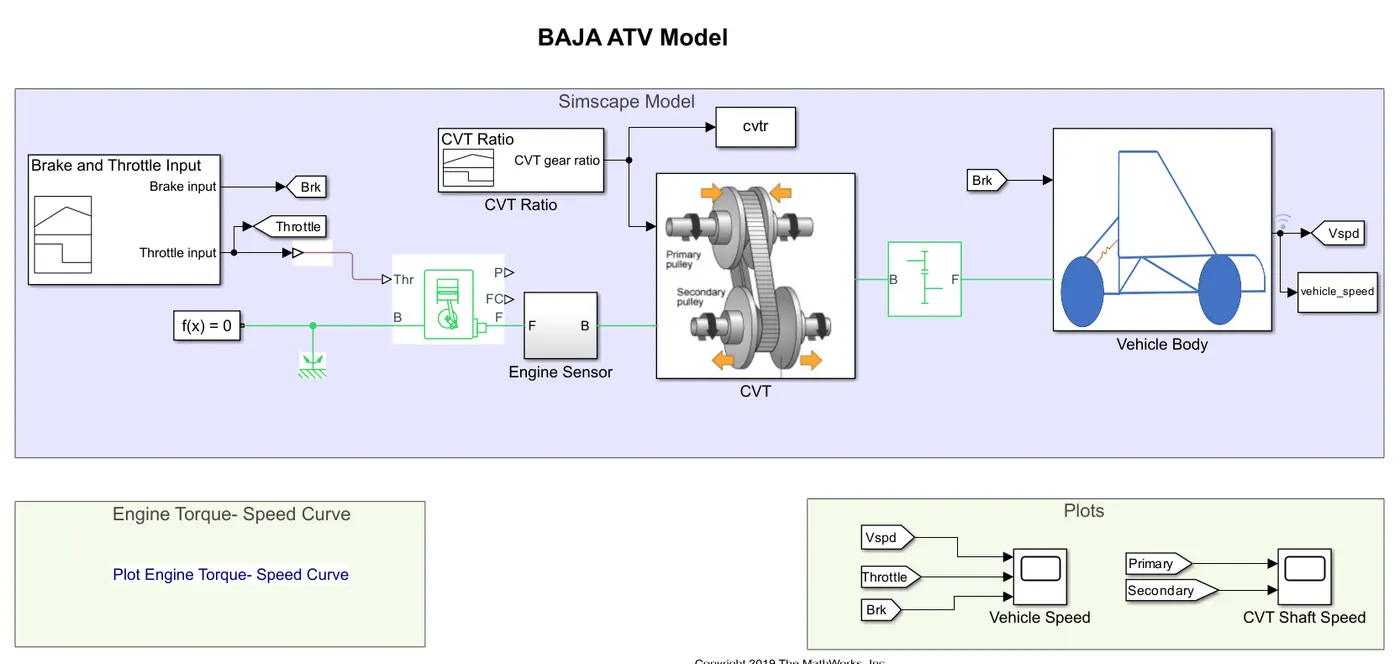
The throttle and brake input are provided using a signal builder.
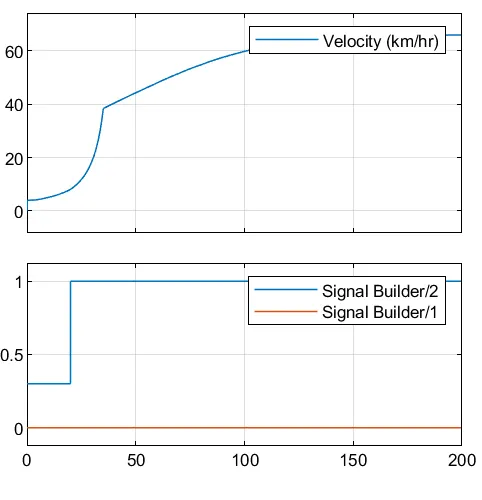
Signal builder 1 - braking
Signal builder 2 - Throttle.
CVT primary RPM and Secondary RPM:
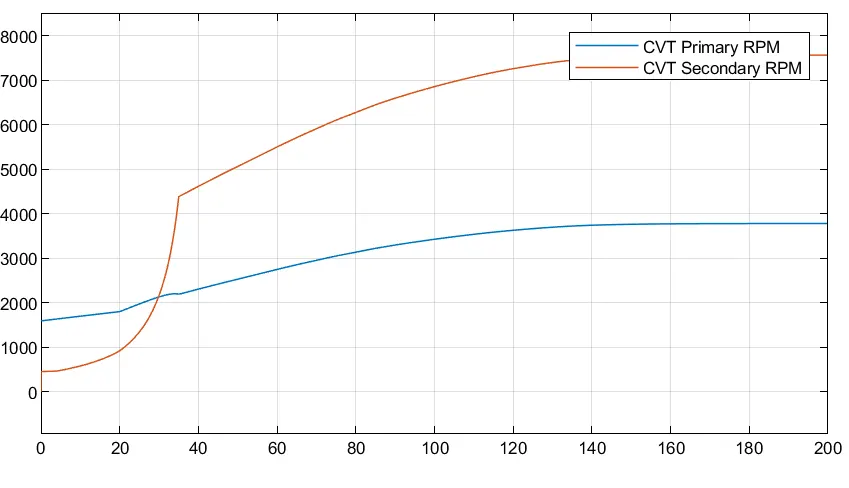
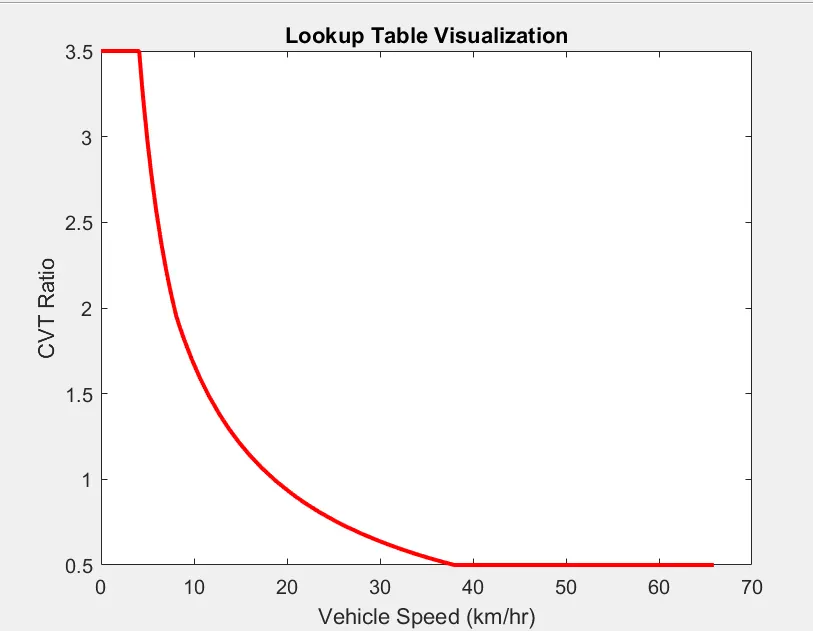
Graph of CVT ratio to the Vehicle speed.
Observation:
We can observe that at higher speed the CVT ratio is smaller and vice versa.
4. cvtModel_mapped
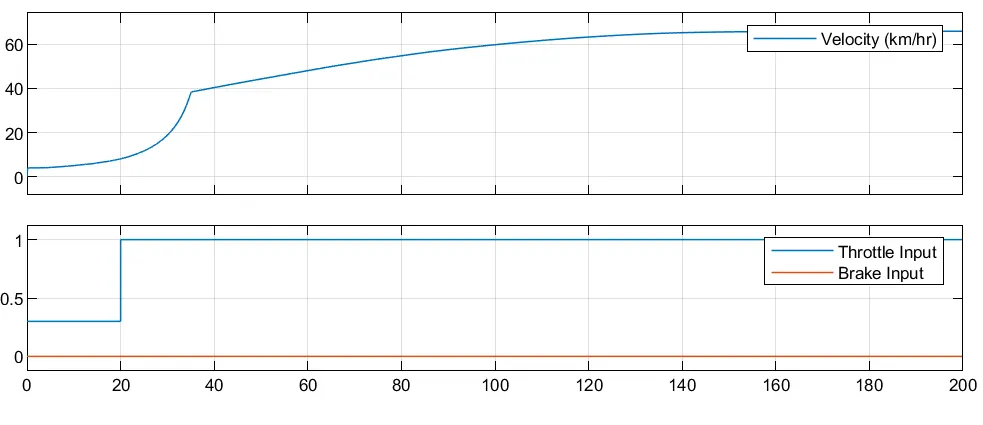
Velocity , Throttle and Brake values:
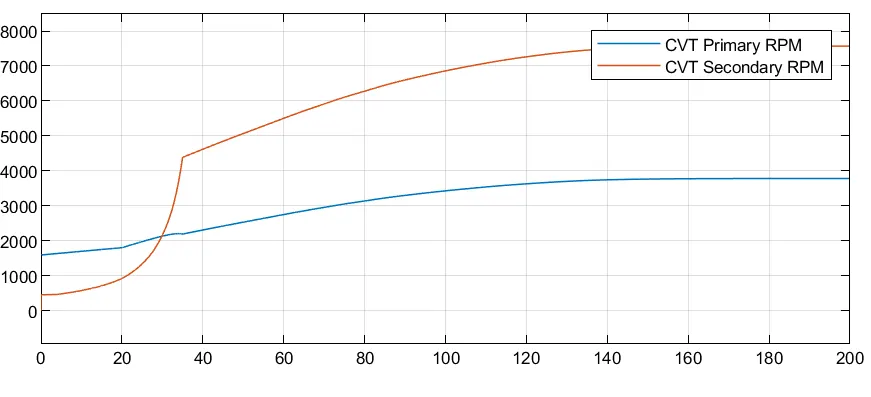
CVT primary RPM and Secondary RPM:
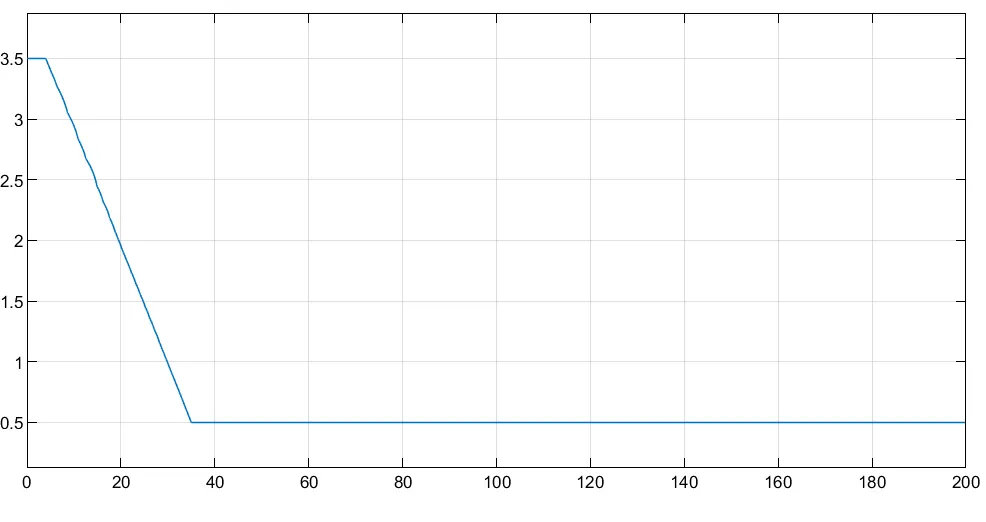
CVT Ratio provided:
Observation:
We can observe that at higher speed the CVT ratio is smaller and vice versa.
5. cvtModel_dashboard_mapped
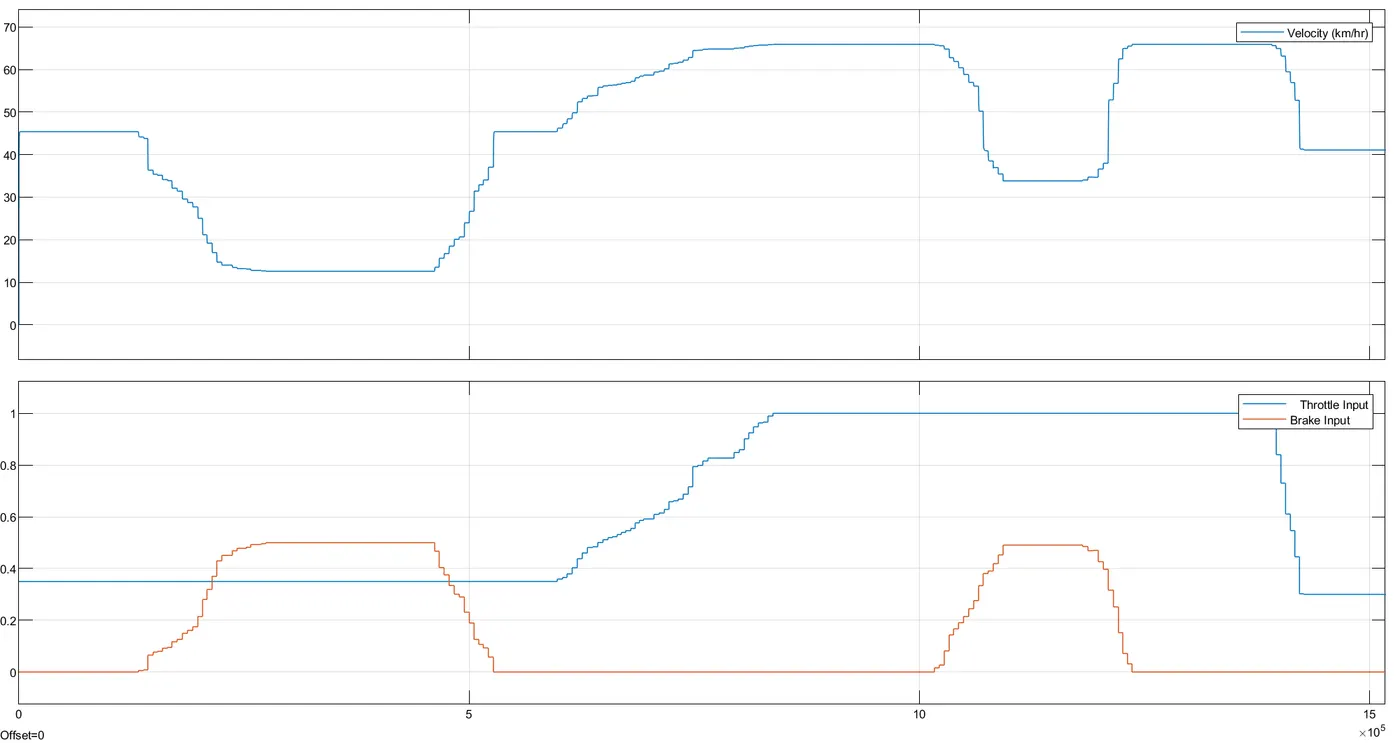
Velocity , Throttle and Brake values:
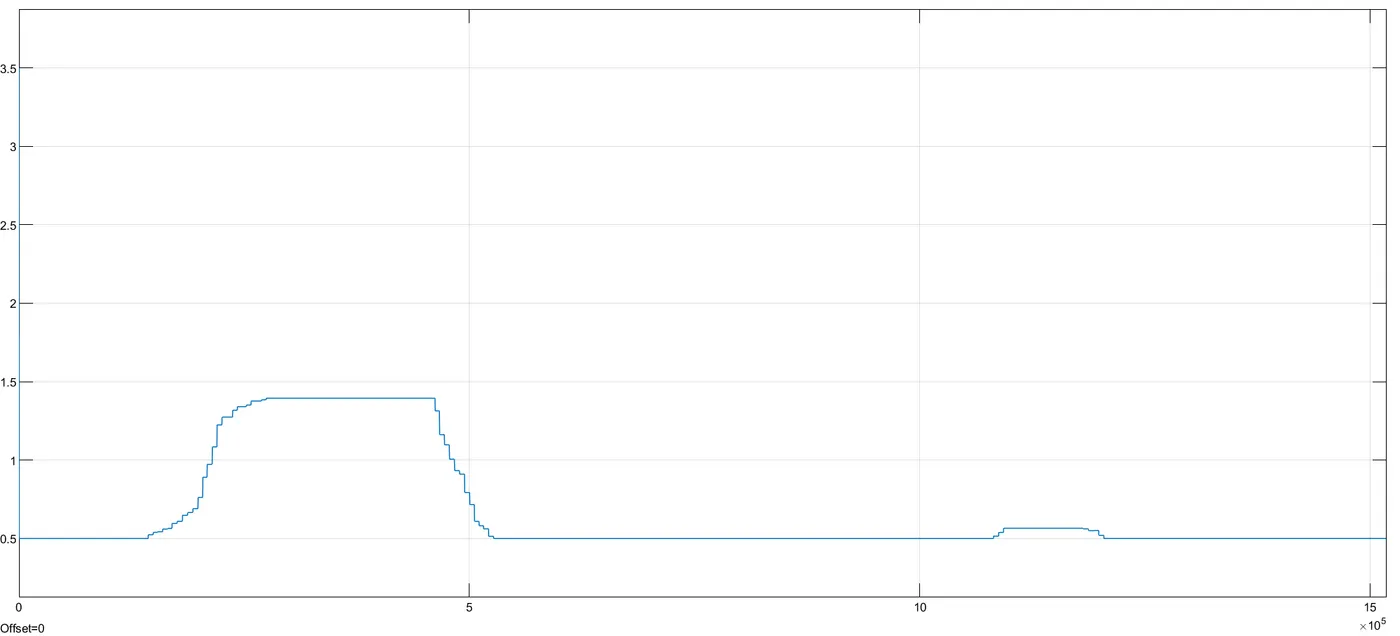
CVT ratio:
The CVT ratio is provided with respect to the velocity .
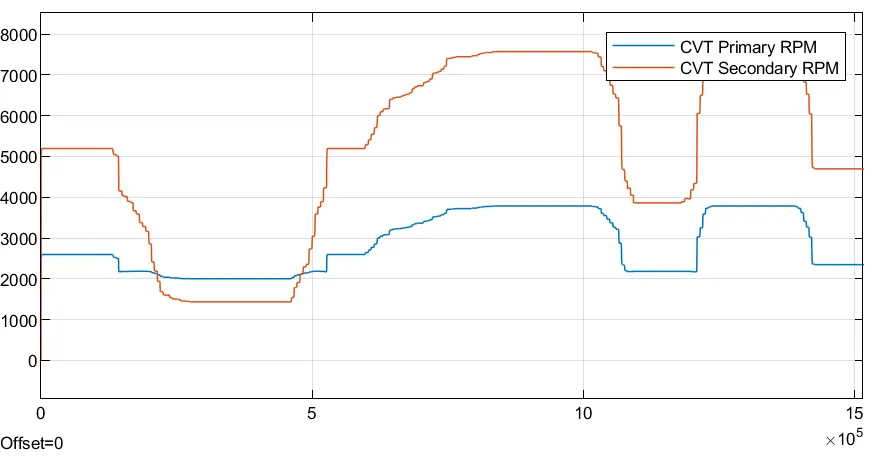
CVT primary RPM and Secondary RPM:
Observation:
We can observe that the CVT ratio is changing according to the velocity as it is how the input is provided and vehicle is inversly proportional to CVT ratio.
6. cvtModel_cvtratio_rpm:
Velocity , Throttle , distance and Brake values:
throttle and brake values provided using signal builder.
cvt ratio:
Ratio varying w.r.t RPM.
CVT primary RPM and Secondary RPM:
Conclusion :
Thus we have studied the six different simulink models of ATV vehicle.