Project
Aim - learn all about ATV (all-terrain vehicle) with the help of Simulink.
Objective - Prepare a technical report explaining the model properties.
Explanation =
1. ATV (All-Terrain Vehicle)
An all-terrain vehicle (ATV) is defined as a motorized off-highway vehicle designed to travel on four low-pressure or non-pneumatic tires, having a seat designed to be straddled by the operator and handlebars for steering control. ATVs are subdivided into two types as designated by the manufacturer. Type I ATVs are intended by the manufacturer for use by a single operator and no passenger. Type II ATVs are intended by the manufacturer for use by an operator and a passenger and are equipped with a designated seating position behind the operator. Similarly, riders must also consider the various ATV sizes.
ATVs are not “one size fits all.” The ATV industry recommends all riders operate an ATV intended for their age. Youth model ATVs are designed for smaller hands and feet and travel at slower speeds appropriate for their age.
2. CVT ( Continuously Variable Transmission)
The CVT (Continuously Variable Transmission) provides smooth and "stepless" ratio changes, unlike conventional transmission systems that use sets of fixed gears. CVT's benefits of fuel economy and seamless acceleration.
The CVT is an automatic transmission that uses two pulleys with a steel belt running between them. To continuously vary its gear ratios, the CVT simultaneously adjusts the diameter of the "drive pulley" that transmits torque from the engine and the "driven pulley" that transfers torque to the wheels. With stepless shifting of gear ratios, the CVT can avoid the shift shock and deliver smooth driving, making it an exceptional transmission solution.
3. Baja SAE
Baja SAE is an intercollegiate design competition run by the Society of Automotive Engineers (SAE). Teams of students from universities all over the world design and build small off-road cars. The cars all have engines of the same specifications. As of 2009, the engine has been an unmodified Briggs & Stratton Intek 20 single-cylinder with a displacement of 300cc and a power output of approximately 10 bhp (7.5 kW).
The goal in Baja SAE racing is to design, build and race off-road vehicles that can withstand the harshest elements of rough terrain. The vehicles used in Baja SAE racing are often similar in appearance to dune buggies. There are multiple dynamic events, usually four per event, as well as a single four-hour endurance race. The dynamic events include hill climbs, chain pulls, maneuverability events, rock crawls, and suspension & traction events.
Static events, such as written reports, presentations, and design evaluations are provided by participating teams.
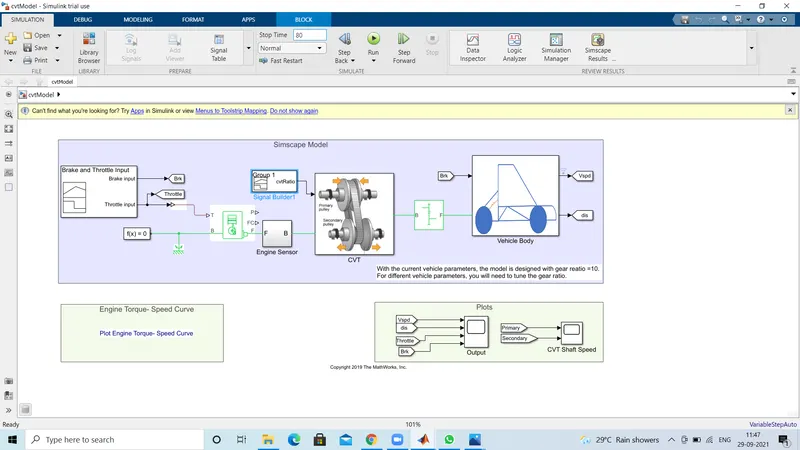
Study 1: Baja ATV model
The study based on the BAJA ATV model with CVT consists of signal Builder with throttle and brake input for a driver, generic Engine, motion sensors, simple Gear, vehicle transmission, vehicle body with tire and solver configuration blocks as shown in the figure below.
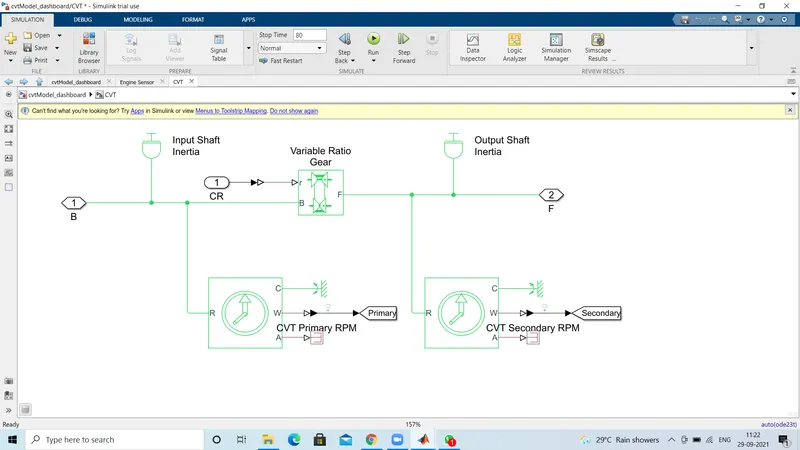
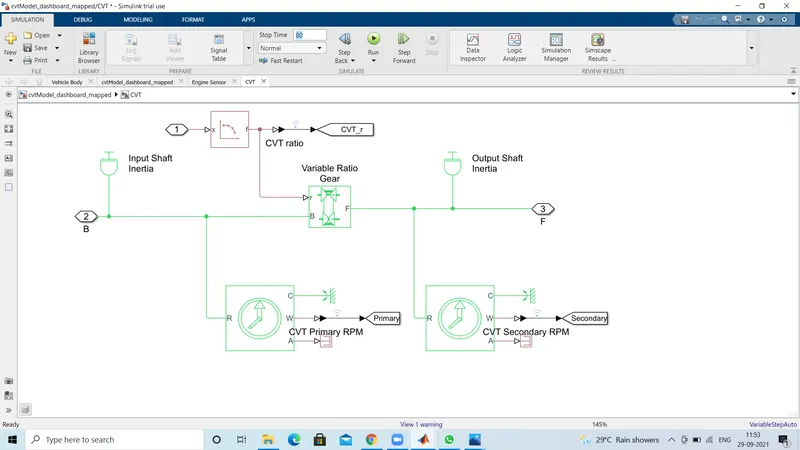
The CVT subsystem consists of a Variable Ratio Transmission block, Ideal rotational motion sensor, input shaft inertia, motion sensors, and output shaft inertia as shown in the figure below:
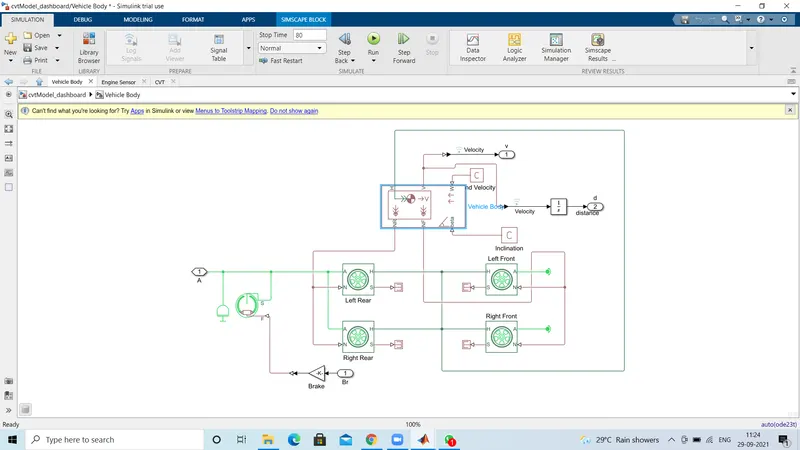
The vehicle body sub-system includes vehicle body block, double drum brake, and tires as shown below:
The vehicle body system includes a vehicle body block, double drum brake, and tires as shown below:
Vehicle body:
Initial engine rpm: 2100 rpm
Mechanical rotation for driven and driver pulley -0.8 and 0.7
Mass of the vehicle = 250 kg
Front and rear axle with 4 wheels
Vehicle Subsystem
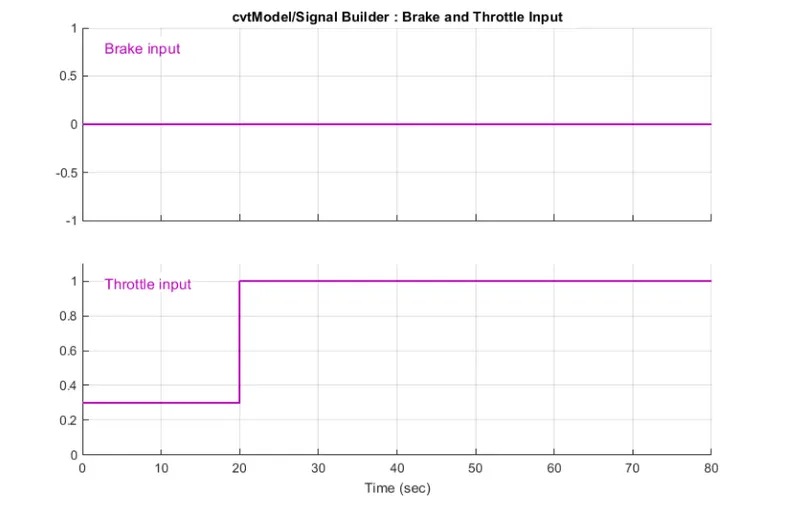
The input is provided using the signal builder for brake, throttle, and gear ratio:
Here the value for the brake is taken as zero for the entire simulation, the throttle value is given as 0.3 to 20 sec, and the value increases to 1 for overall simulation ie,80 sec.
As we know that as throttle increases then the power increases by excess input of fuel into the system and shows in the output also increasing
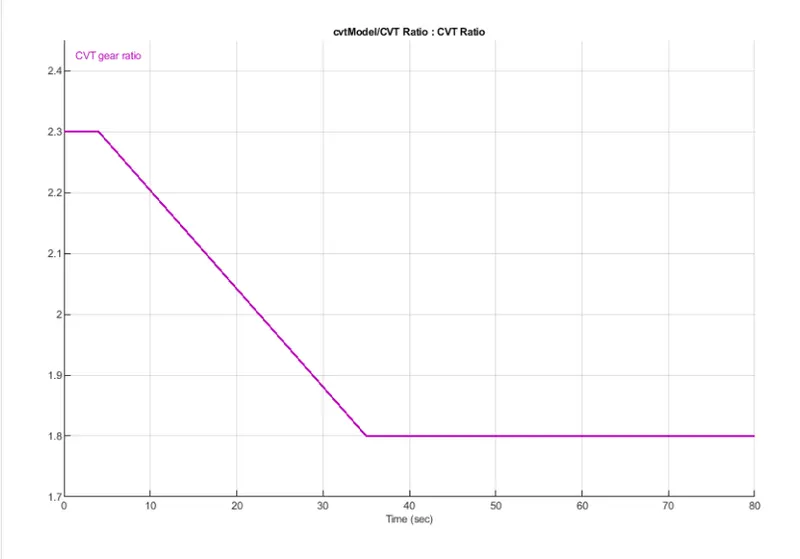
The value of gear ratio is maintained as 2.3 for the first 5 sec and decreases to 1.8 up to 35sec linearly so after that a constant value of that 1.8 is maintained all out the time span ie, 80 sec
Study -2
Baja ATV Model Dashboard
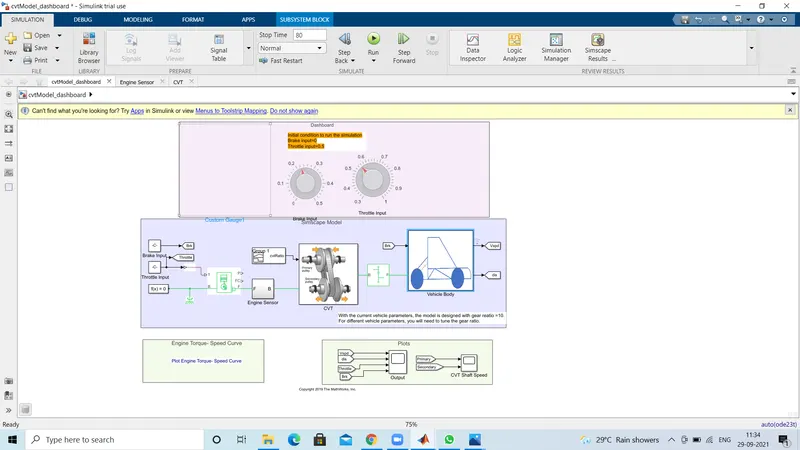
The study is based on 'Baja ATV with the dashboard as shown in the figure above here the input data like throttle and brake input are given from the
dashboard instead of inputted with the help of a signal builder. All the remaining blocks are the same as in the study above
(ie, study-1)
The main intention behind the usage of the dashboard is to study the output value with the variation in the inputted values of throttle and brake, which will give the value of rpm and velocity of the engine in the digital reading.
The value of gear ratio is maintained as 2.3 for the first 5 sec and decreases to 1.8 up to 35sec linearly so after that a constant value of that 1.8 is maintained all out the time span ie, 80 sec the value for the brake can be varied from 0 to 0.5 for the entire simulation. As we know that as throttle increases then the power increases by excess input of fuel into the system and shows in the output also increasing and vice versa.
study-3
Baja ATV model using a lookup table
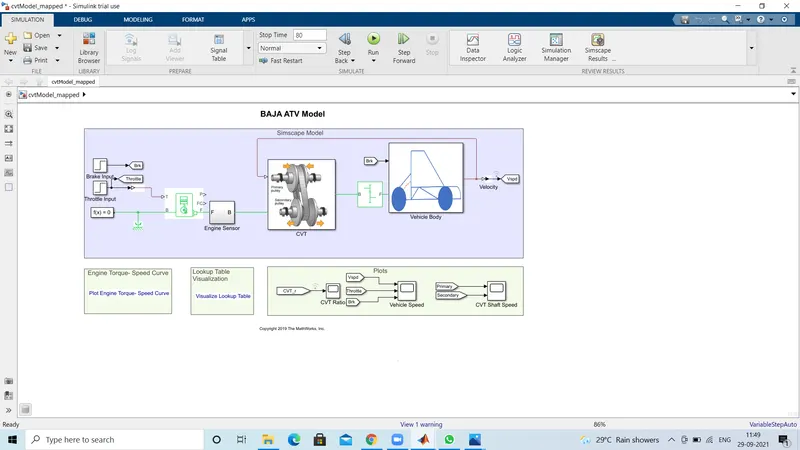
The above Simulink model of Baja ATV with CVT includes the step time, generic engine, motion sensors, vehicle transmission, vehicle body, tires, and solver configuration.
The CVT system includes a look-up table, an array of data that maps input values to output values, thereby approximating a mathematical function. If we give an input set of values, a look-up operation retrieves the corresponding output values from the tables. If the look-up table does not explicitly define the input values then the Simulink can estimate output value using interpolation, extrapolation, or rounding
• Interpolation: It is the process of estimating values that lie between known data points
• Extrapolation: It is the process of estimating values that lie beyond the range of known data points.
. Rounding. It is the process of approximating the values by altering its digits according to a known value
CVT Subsystem
Vehicle Subsystem
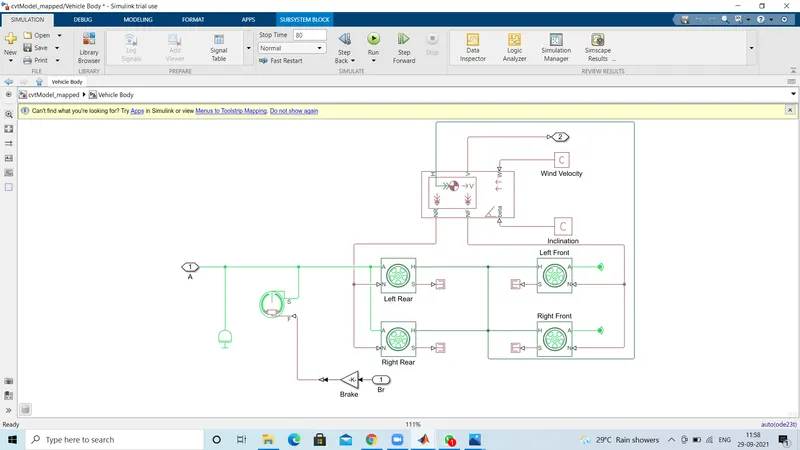
The brake and throttle input is given by step time, which depends on the run time and it varies accordingly. By using the loop-up table for the gear ratio and it gives the input to the CVT part and accordingly obtains the output. This method works in a closed-loop and the inputs are given with the loop-up table data. Here the Simulink gets the input values from the look-up tables and according to the values from the input, the output is got in terms of gear ratio.
Lookup Table Visualization
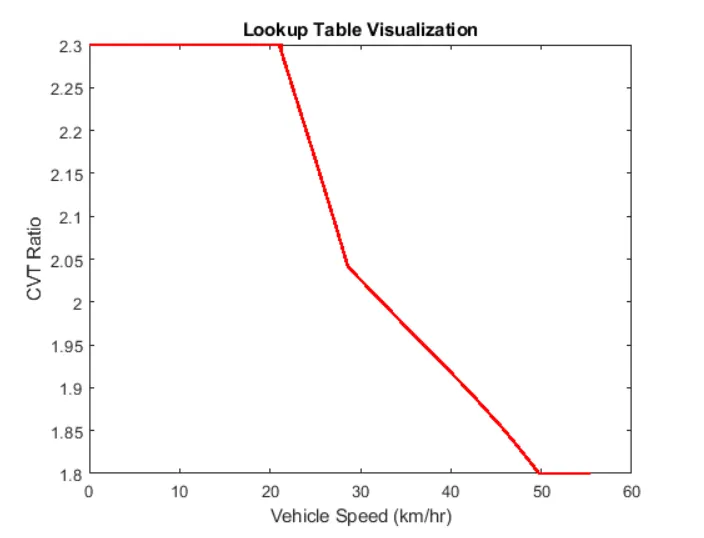
With the gear ratio varies from the range of 2.3 to 1.8 and the output in terms of velocity is got as for the range of gear ratio at a maximum value of nearly 56km.
Study-4
BAJA ATV Model with Dashboard using a lookup table
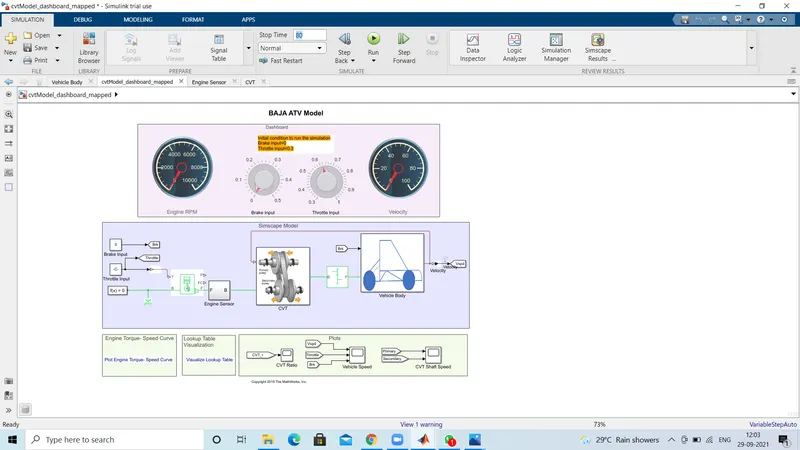
The above study is based on the Baja ATV with the dashboard model using the look-up table which consists of throttle and brake meters in the dashboard. With the help of the dashboard, we can see the variation of the output with the input values been varied.
Here as we know the gear ratio is inputted from the look-up table and the Simulink will give the output to inputted values. The gear ratio is directly proportional to the torque. As we know that as throttle increases then the power increases by excess input of fuel into the system and shows in the output also increasing.
Output: Study-1 (Without dashboard)
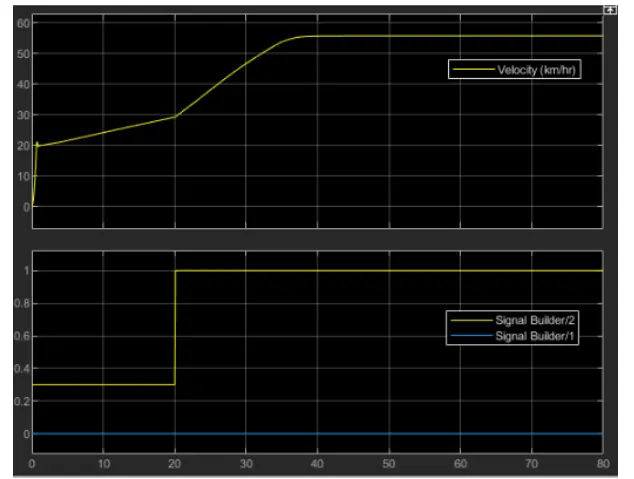
Here the brake value is set as a constant ie, zero, and the throttle value from 0.3 to 1 in a time range of 20 seconds and such that the fuel injection happens in a time basics and the velocity part shows a raise as the throttle values increase by a constant linear line. From the above velocity vs time graph as the velocity part increases and is set to a constant value due to throttle values is constant thereafter.
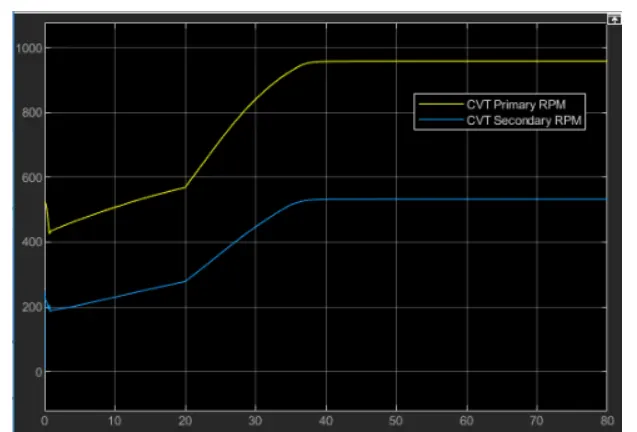
Here the ratio is determined by the outer to input diameter so that when the radius of the output part is high then the rpm will decreases which is incase reflecting in the above graph.
Output: Study -2 ( dashboard)
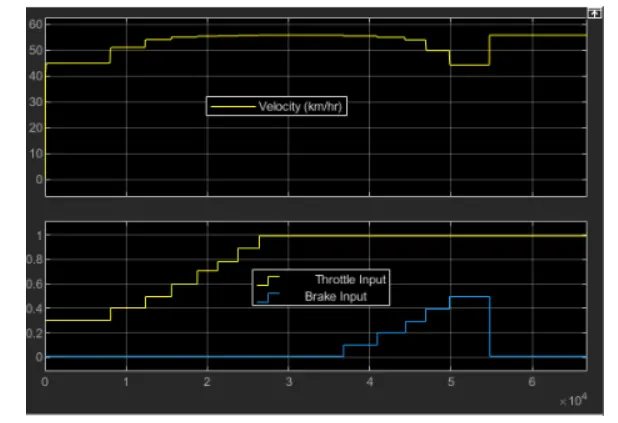
From the above graph, the brake is applied in this case we can see the decrease in the velocity part. Herewith the value of the throttle is increased in instant to 0.3 and maintained so that the velocity also increases rapidly to a value of nearly 47kmph and being at a constant as the throttle value increases the fuel input increases and the velocity increases and here shows as the throttle increases the vehicle velocity also increases from the graph above.
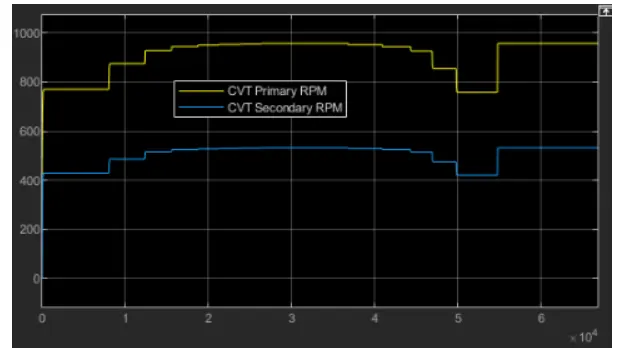
Here the ratio is determined by the outer to input diameter so that when the radius of the output part is high then the rpm will decreases which is incase reflecting in the above graph.
conclusion = I Run Baja ATV with and without a dashboard and lookup table model in Matlab and prepared detail report