Project 2 Thermal modeling of battery pack
objective: To simulate the thermal effects and compare life cycle performance at various temperatures, charge and discharge rates using MATLAB for a 10 cell series lithium-ion battery.
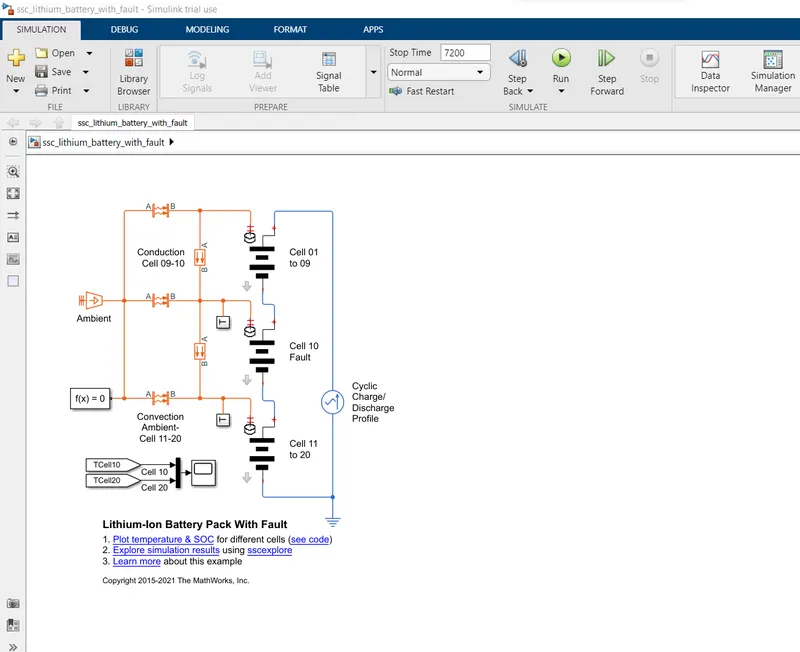
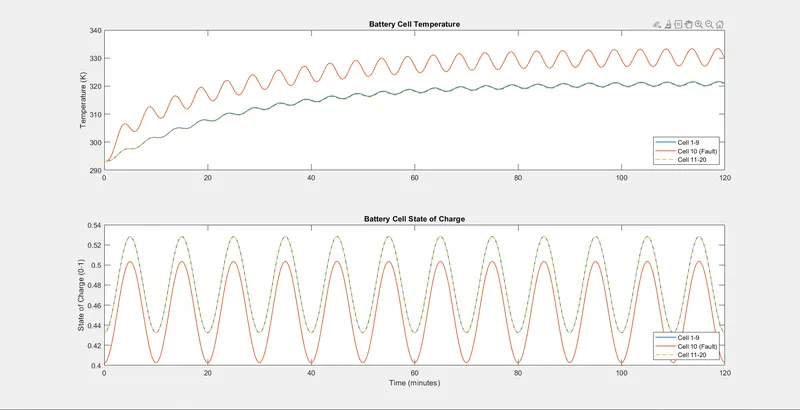
This example shows how to simulate a battery pack consisting of multiple series-connected cells in an efficient manner. It also shows how a fault can be introduced into one of the cells to see the impact on battery performance and cell temperatures. For efficiency, identical series-connected cells are not just simply modeled by introducing both capacity and open-circuit voltage and increasing the resistance values
Modified Simulink Model
connections:
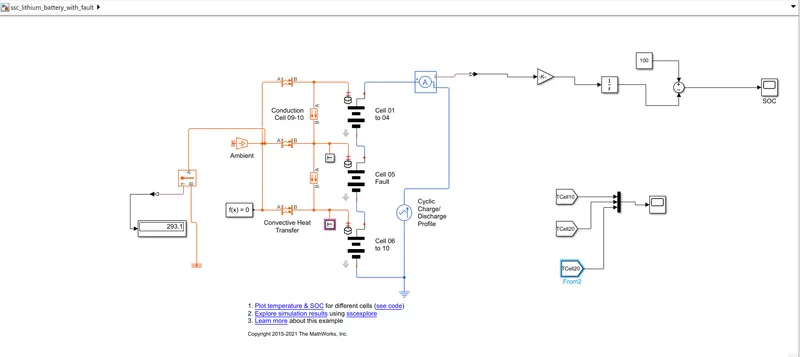
- to obtain a 10 cell series lithium-ion battery model, the no. of cells in the first battery pack was changed to 4, the second pack to 1 and in the third pack the no. of cells in the battery pack was changed to 5.
- T subsystem block is used for each pack to plot the temperature graph for the individual battery packs.
- An ambient temperature source is attached as shown above
- temperature sensor is attached which is also connected to display and thermal reference.
- the display shows temperature.
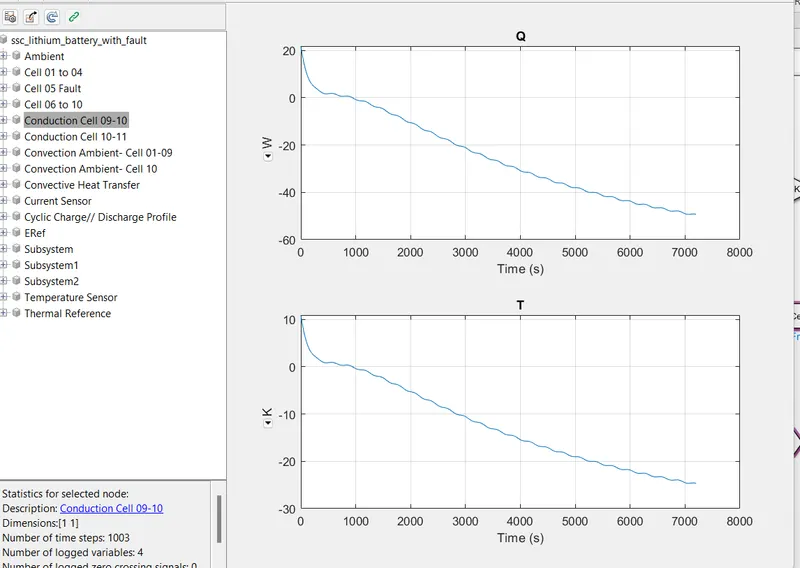
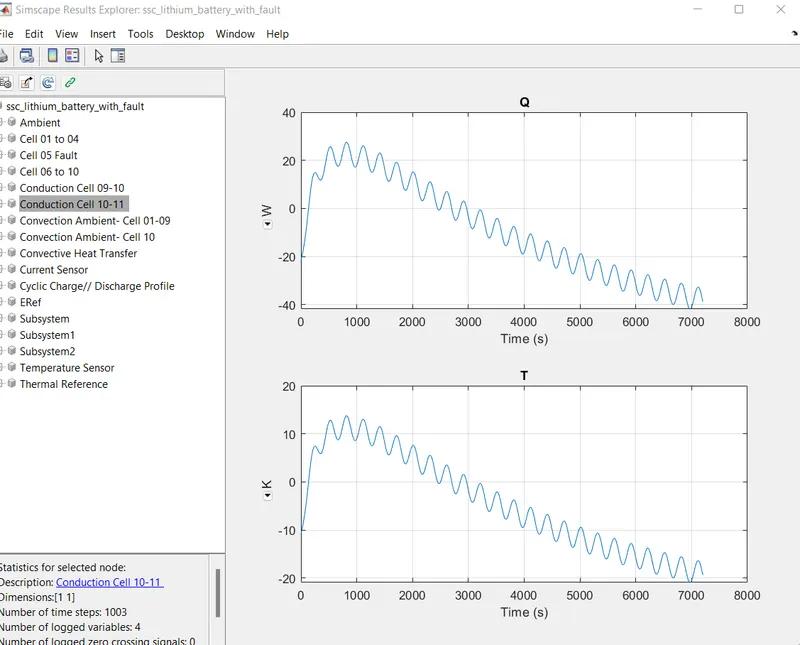
- both conduction and convection heat transfer blocks have been used for heat transfer between packs.
Modification
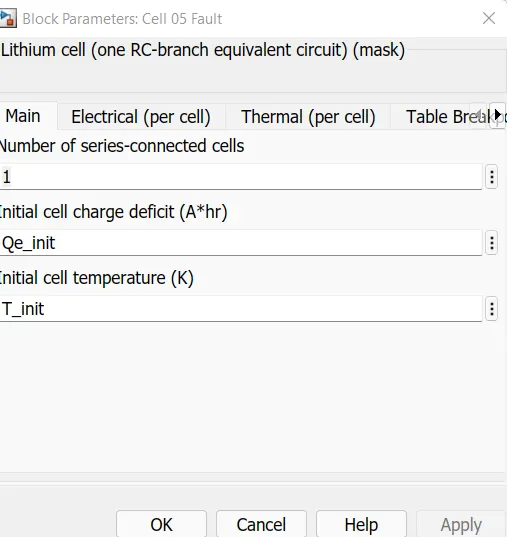
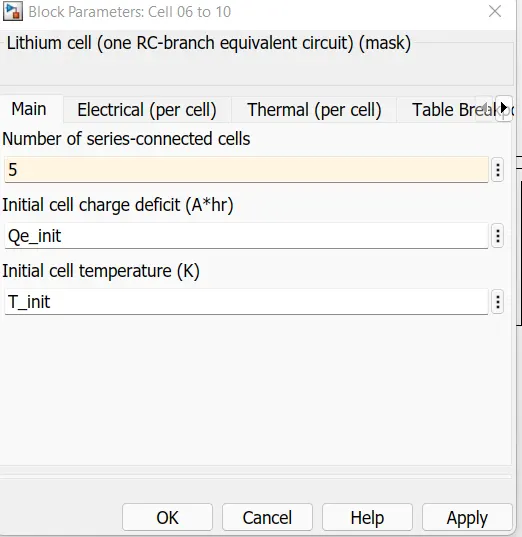
Parameters
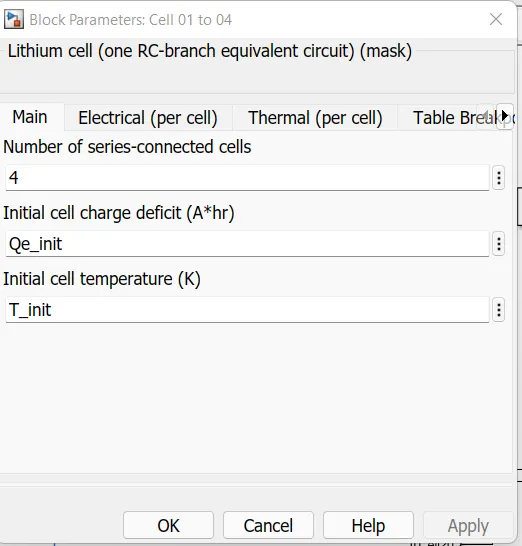
the first and the third pack contain 4 cells and 5 cells respectively while the second pack is designed to be at fault causing undesirable thermal effects. this is indicated in the electrical parameters as shown below:
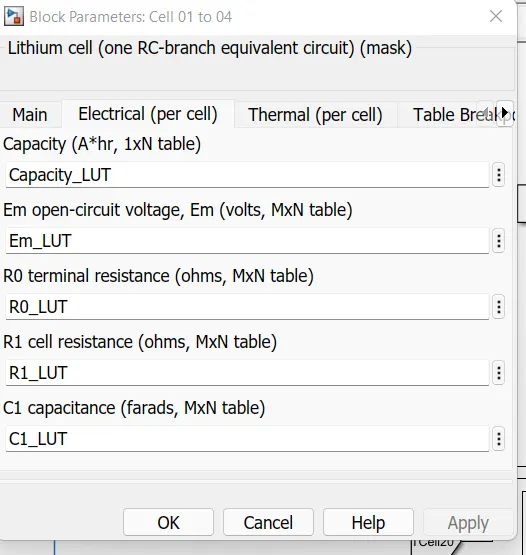 for cells 01 to 04
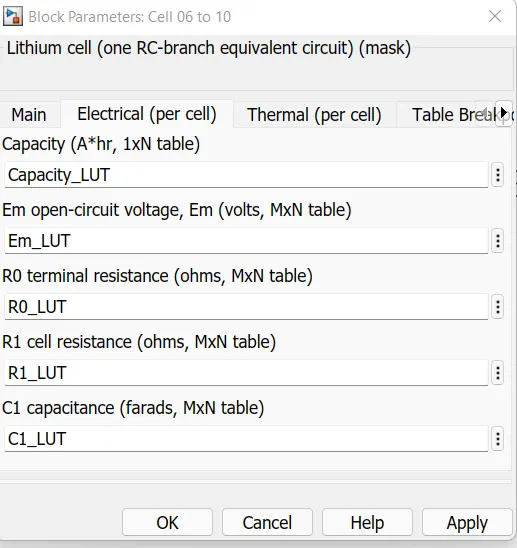 for cells 06 to 10
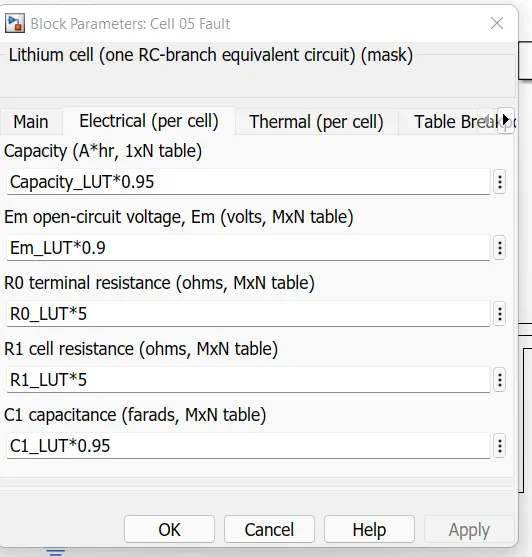 for second pack having fault condition
Temperature Sensing Subsystem
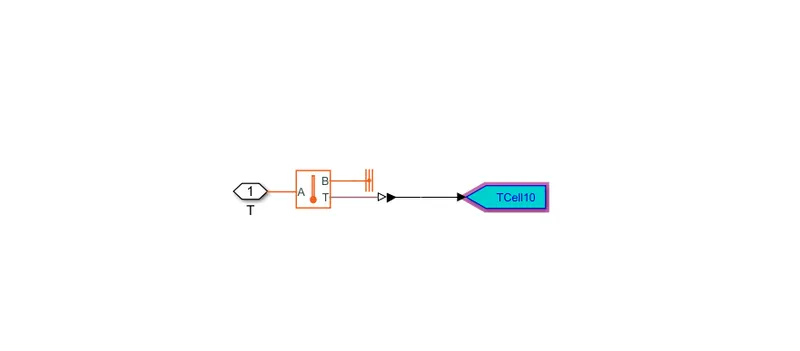
Temperature Sensor
the temperature sensing block represents an ideal temperature sensor that is a device that determines the temperature differential measured between two points without drawing heat.
Thermal Reference
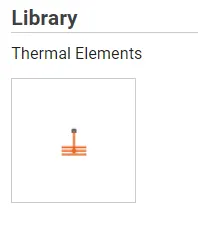
the thermal reference block represents a thermal reference point that is a point with absolute zero temperature with respect to which all the temperatures in the system are determined.
Temperature Source
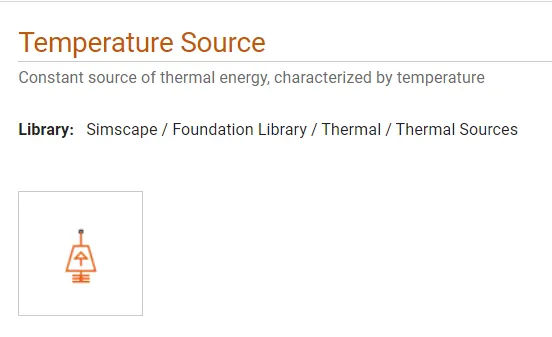
the temperature source block represents an ideal source of thermal energy that is powerful enough to maintain a specified temperature at its outlet regardless of the heat flow consumed by the system. the source generates constant absolute temperature defined by the temperature parameter value.
Conductive Heat Transfer Block
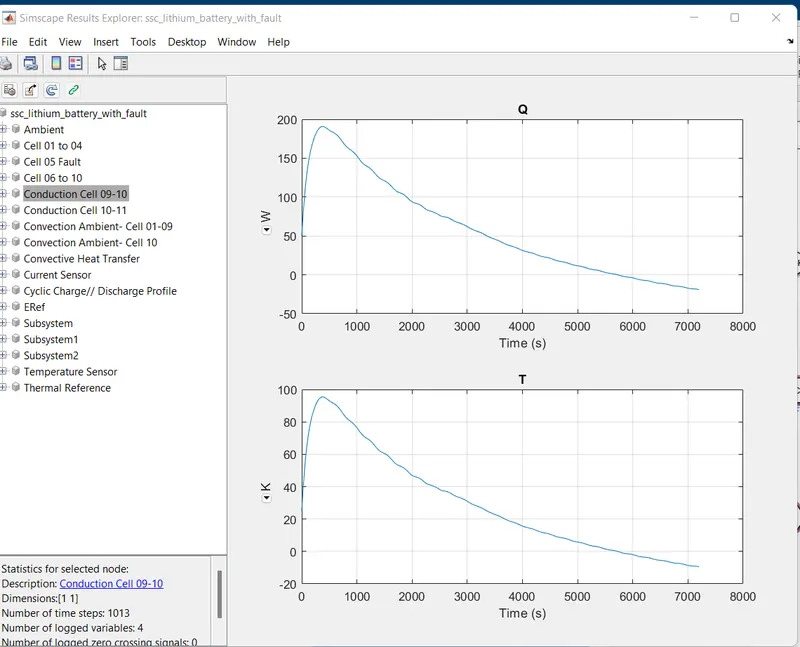
the conductive heat transfer block represents heat transfer by conduction between two layers of the same material.the transfer is governed by Fourier law and is described with the following equation:

Convective Heat Transfer Block
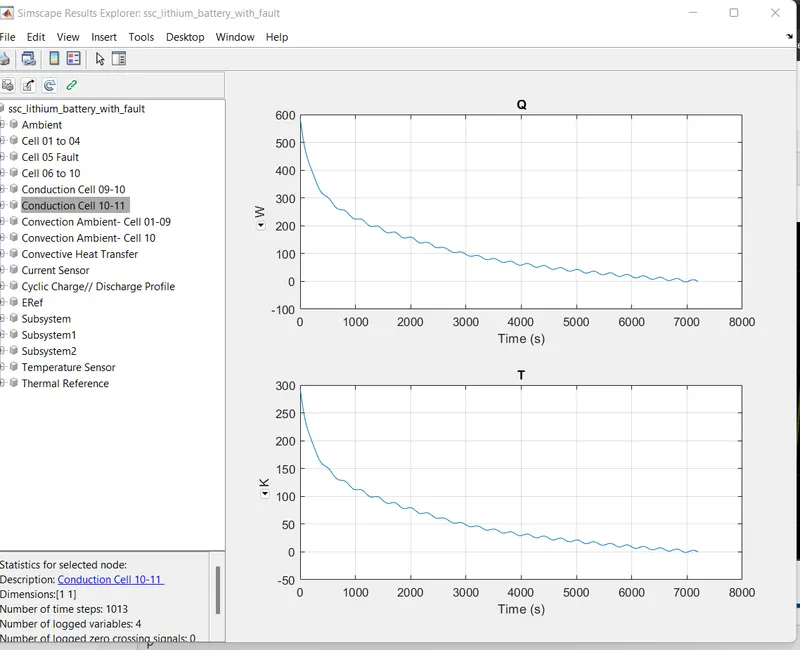
the convective heat transfer block represents heat transfer by convection between two bodies by means of fluid. the transfer is governed by Newtons Law Of Cooling and is described with the following equation:

Cell 01 to 04 subsystem
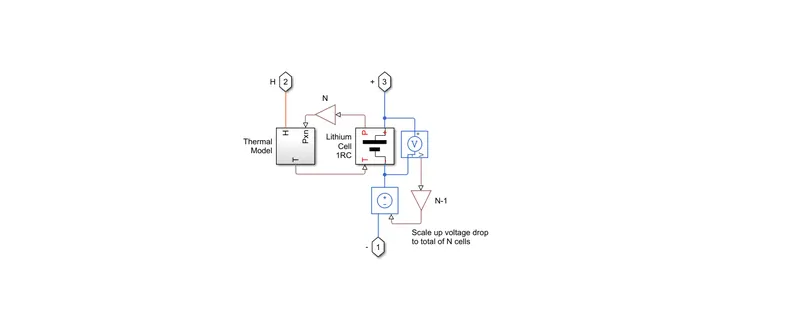
the cell subsystem consists of a thermal model and lithium cell 1RC block which calculate the temperature and thermal effect for cells and overall calculate for the battery pack. the voltage sensor block represents an ideal voltage sensor, a device that converts voltage measured between any electric connection into a physical signal proportional to voltage.
Lithium Cell 1RC subsystem
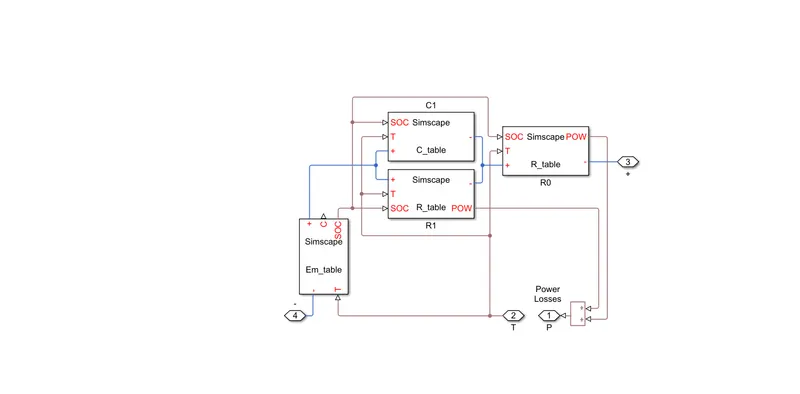
this block consists of a capacitor value table which depends on external physical input signal SOC and T. voltage value (EM) implements the cells main branch voltage source and determines values for capacity C and state of charge.
Observations for different cell temperatures
| condition | Ambient temp.(K) |
Cell Temp.(k) (01-04 cells) |
Cell Temp.(k) 05 cell (fault ) |
Cell Temp.(k) (06-10 cells) |
observations |
| 1 | 299.1 | 299.1 | 299.1 | 299.1 | equal temperature |
| 2 | 299.1 | 310 | 299.1 | 310 | cell 5 at minimum temp. |
| 3 | 299.1 | 310 | 320 | 330 | low to high temperature |
| 4 | 299.1 | 350 | 325 | 30 | high to low temperature |
| 5 | 299.1 | 310 | 350 | 310 | cell 5 at maximum temperature |
Condition 1 graphs
cell temperature
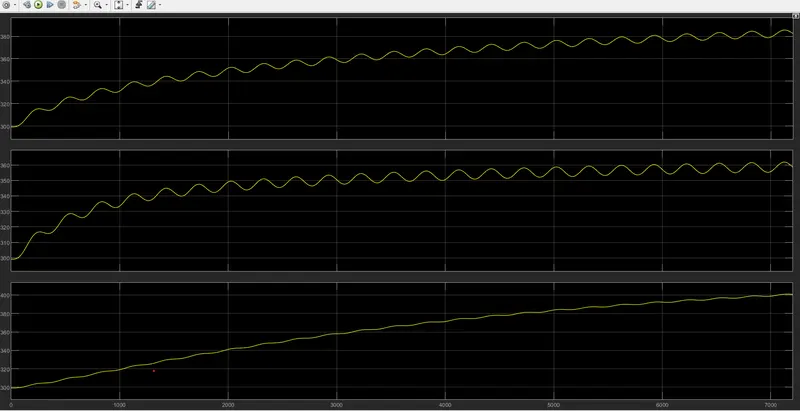
all three cells have the same temperature which is 299.1k. the graph for cell 5 has more oscillations because of fault condition.
SOC
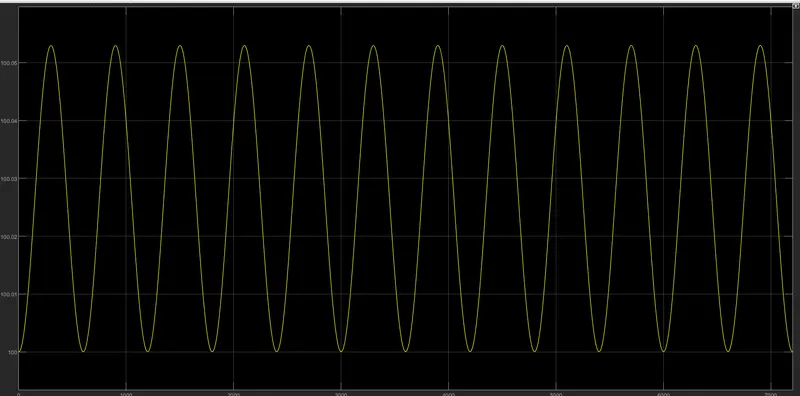
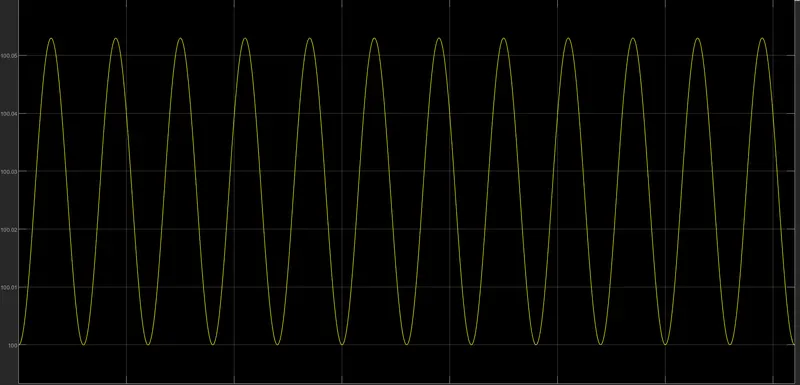
this waveform is achieving a value of more than 100.06 pertaining to the modifications made in temperature.
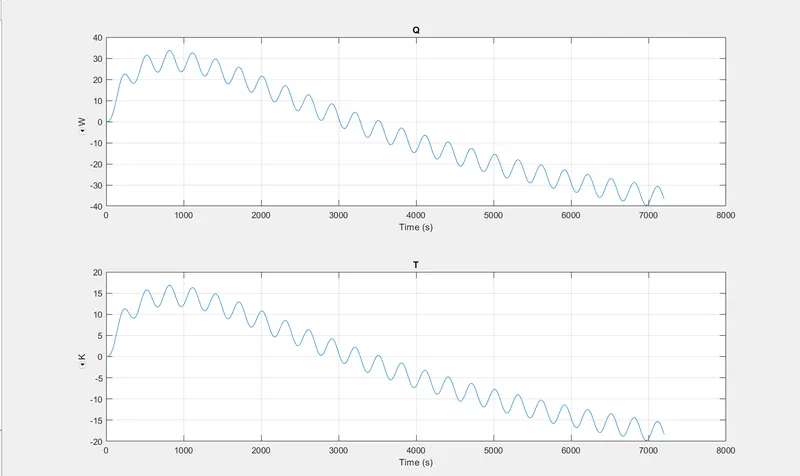
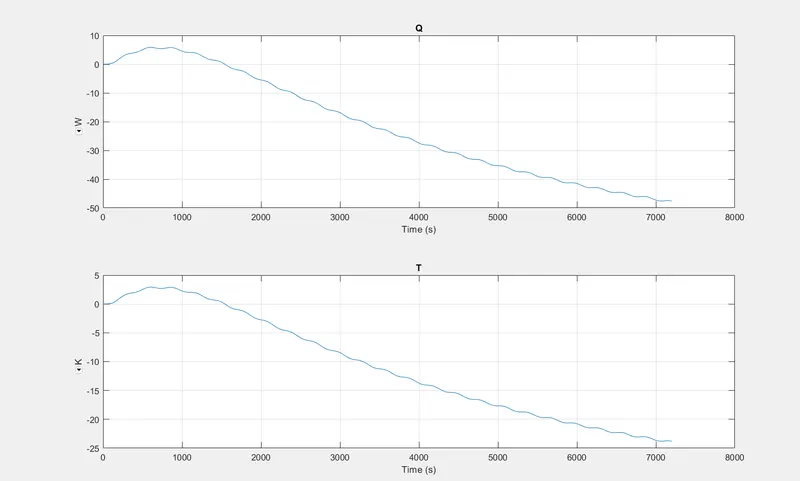
Conduction
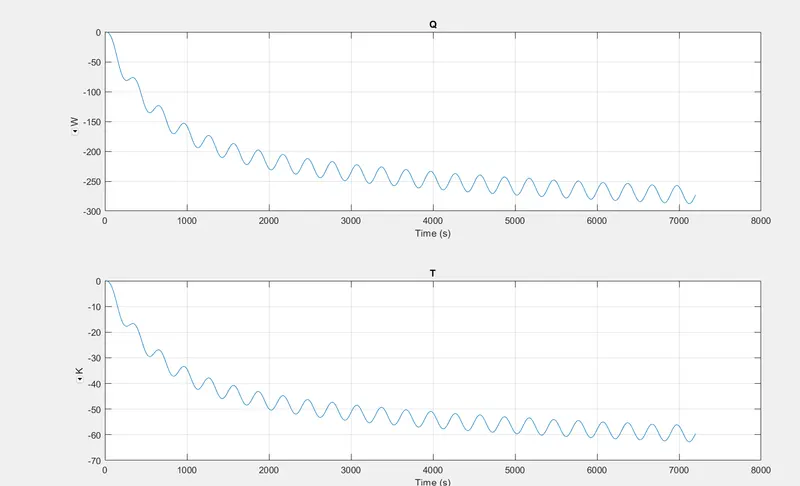
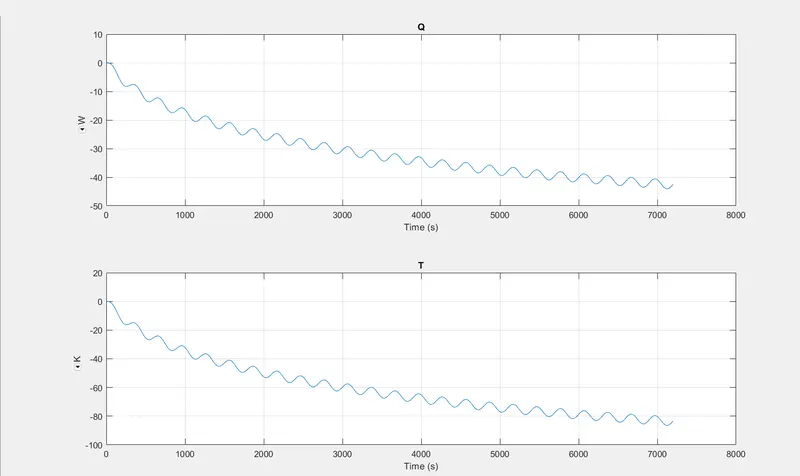
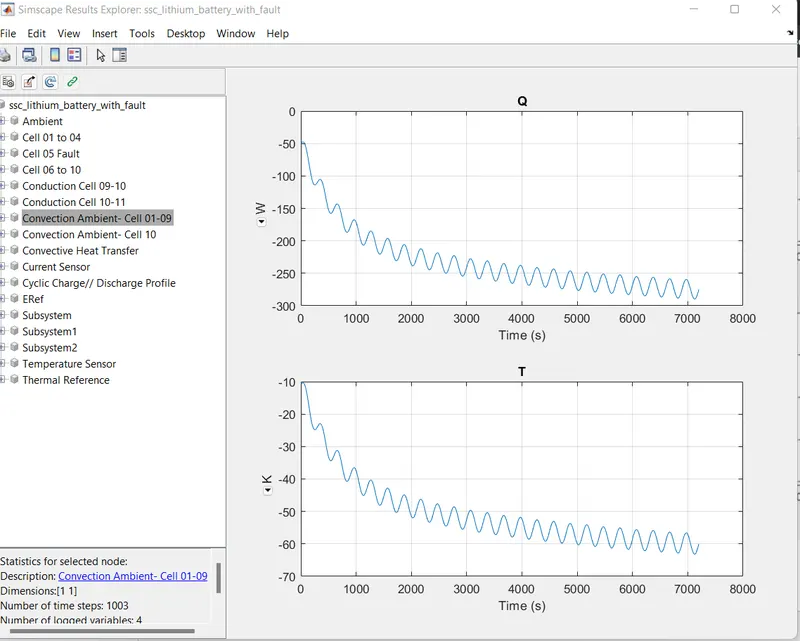
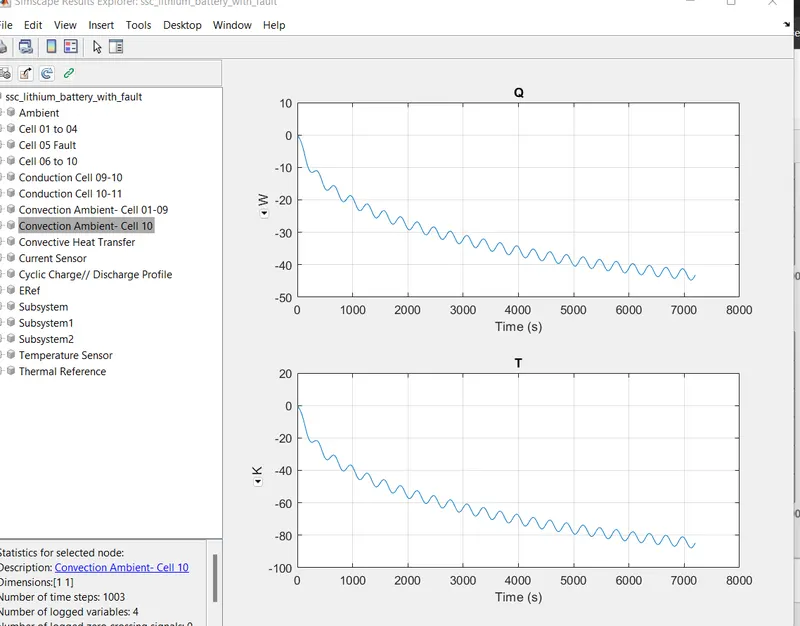
Convection
Condition 2 graphs
cell temperature
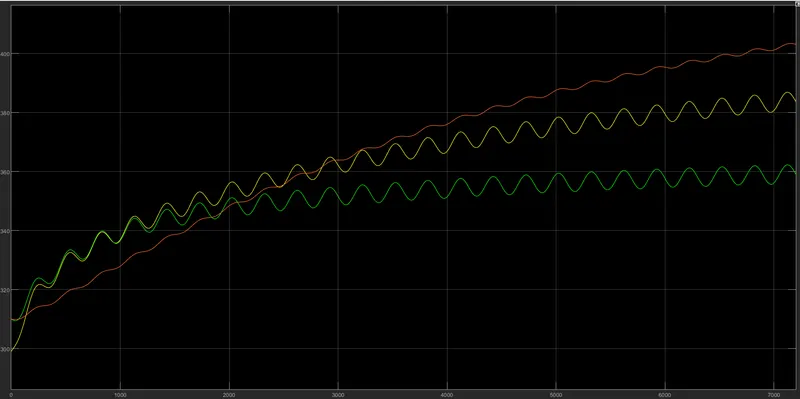
in this test condition cell 5 (fault ) is kept at maximum temperature. here cell no.4 and cell no.10 start at 310k as there starting temperature and cell no.5 starts at 299.1k.
SOC
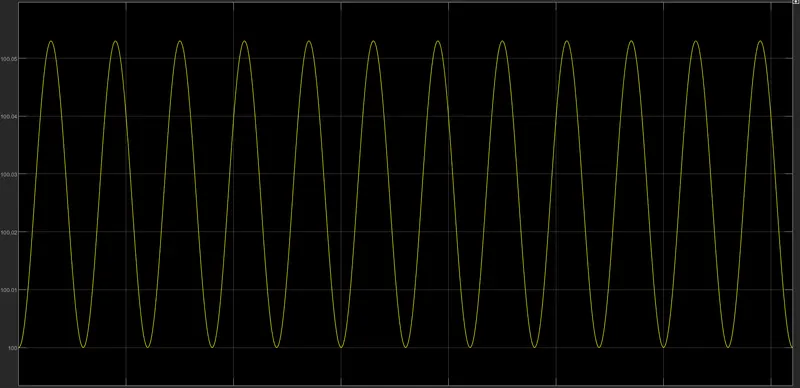
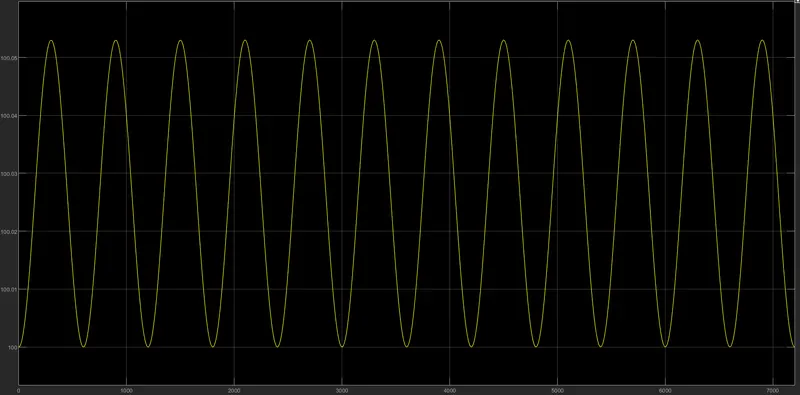
SOC goes above 100.05 pertaining to the various temperatures of the cell pack in this test condition.
conduction
Convection
Condition 3
cell temperature
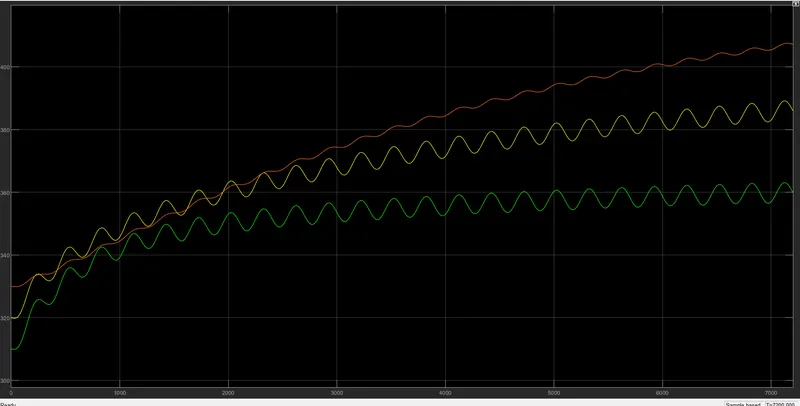
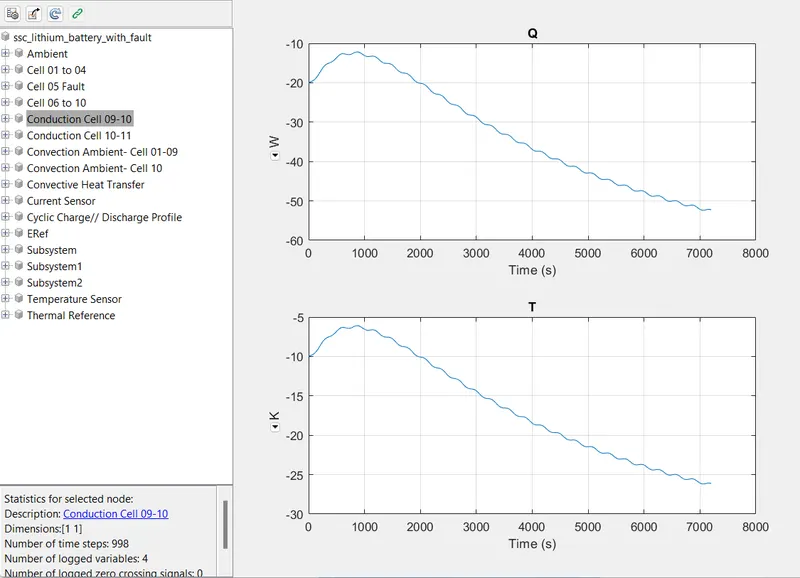
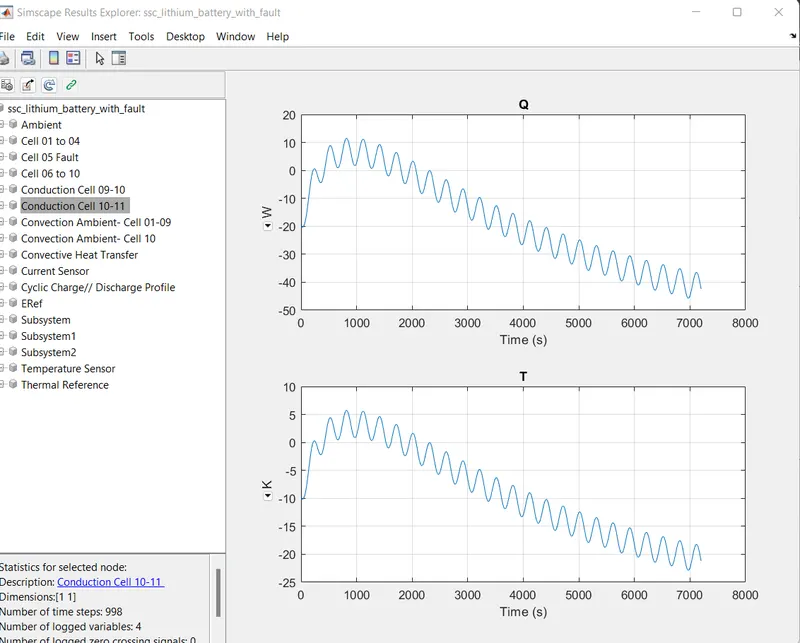
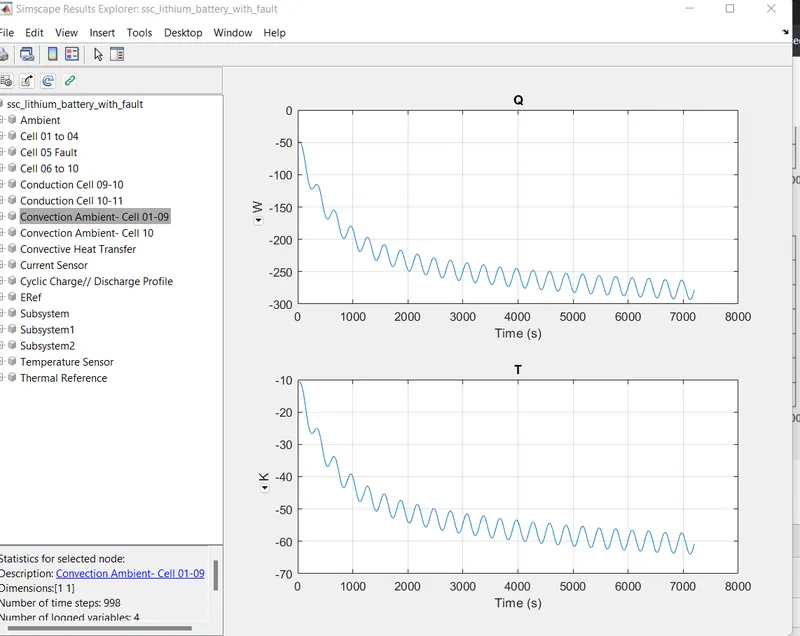
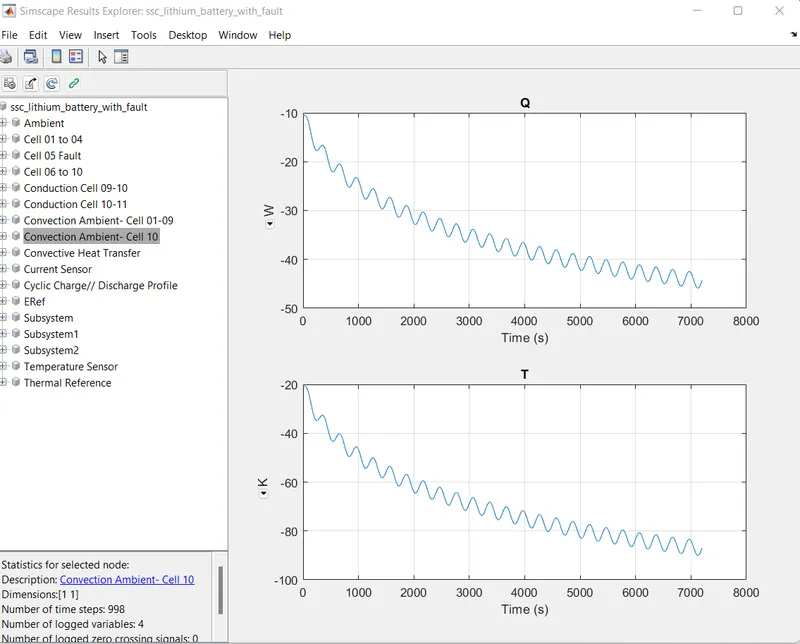
in this test condition the observation is made for temperatures changing from low temperature to high temperature. here cell no. 10 has a starting temperature of 330k, cell no.5 starts at 320k and cellno. 4 at 310k as observed from graph.
SOC
Conduction
Convection
condition 4
cell temperature
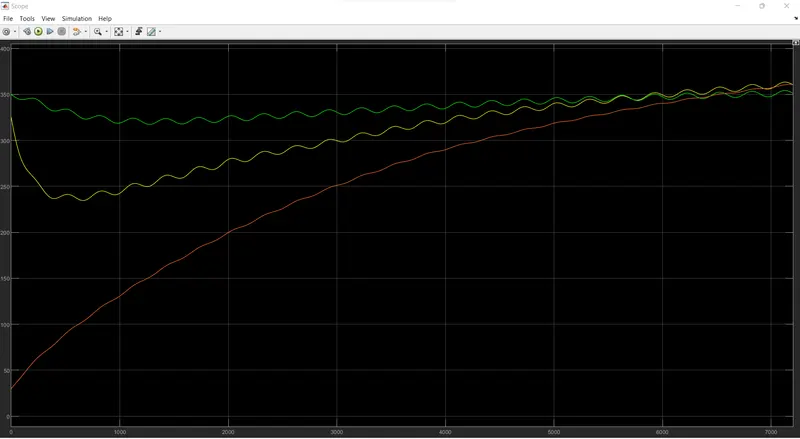
here the initial temperature of cell no. 4 is 350k, and cell no.10 is at an initial temperature of 325k. cell no. 5 has an initial temperature of 30k. here the graphs are analyzed for when the temperature changes from high temperature to low temperature.
soc
conduction
convection
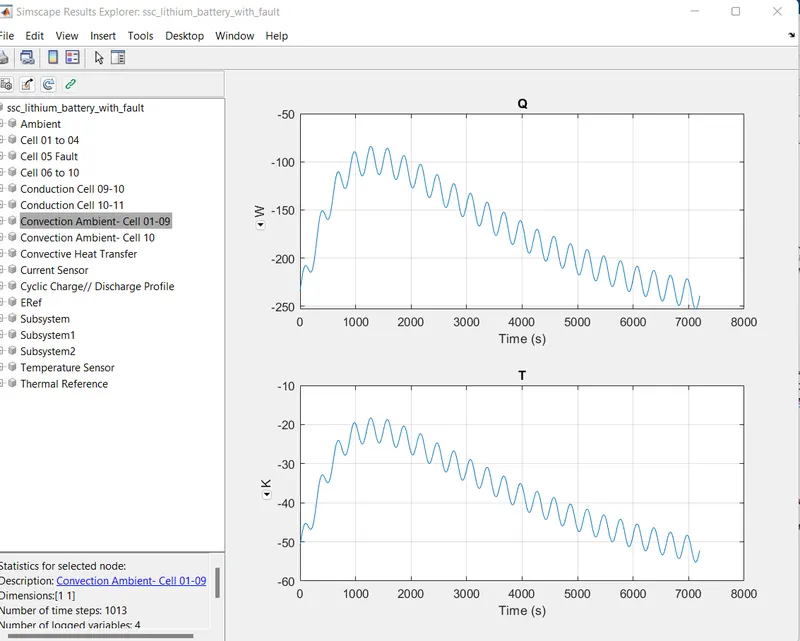
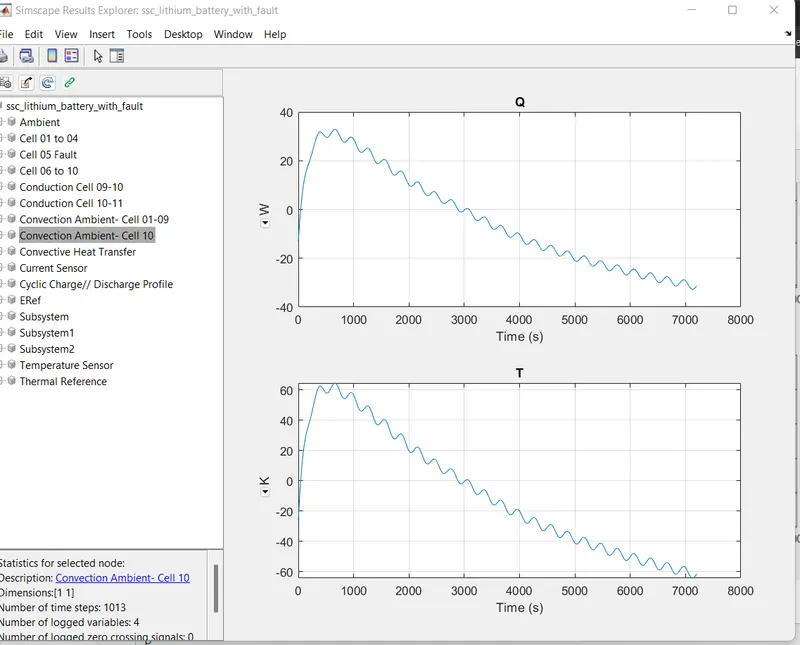
Condition 5
cell temperature
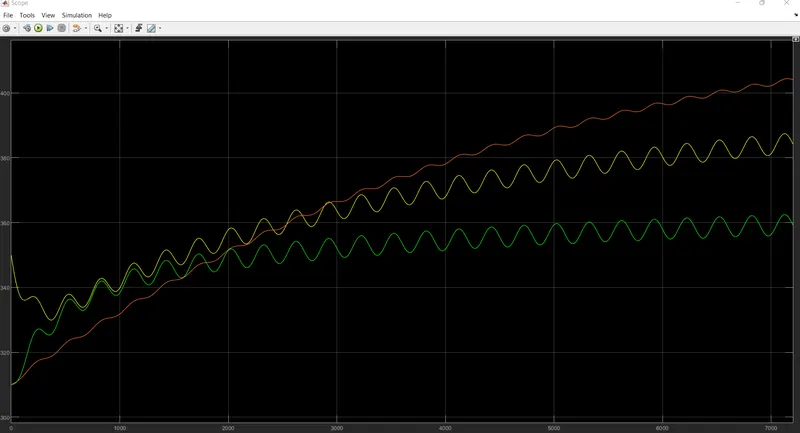
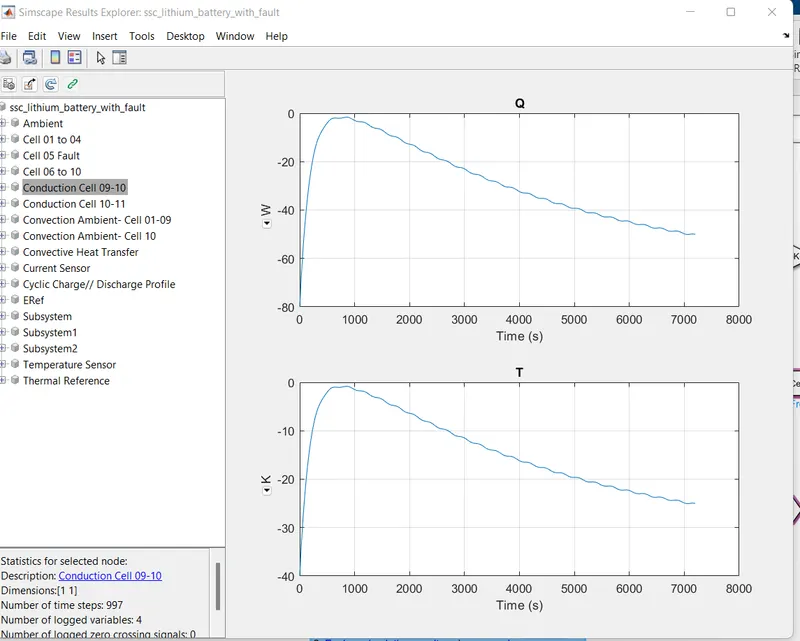
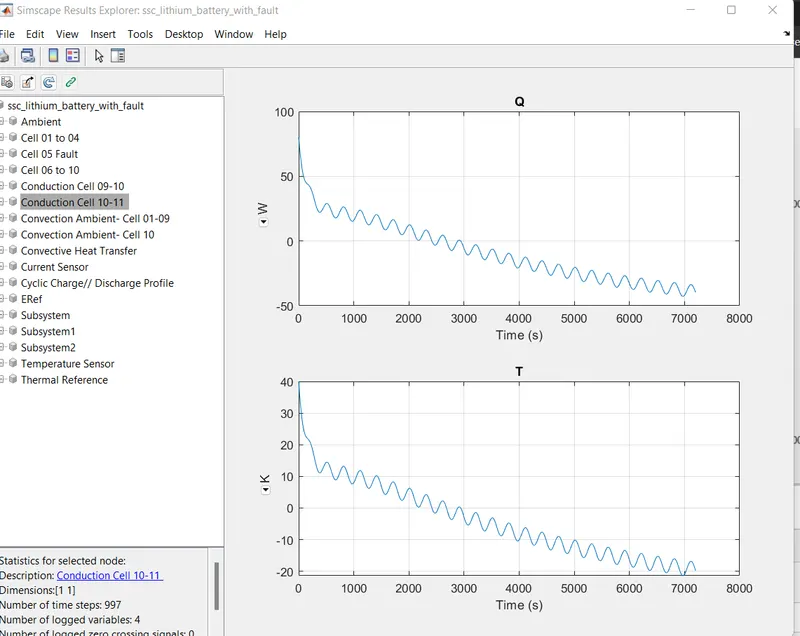
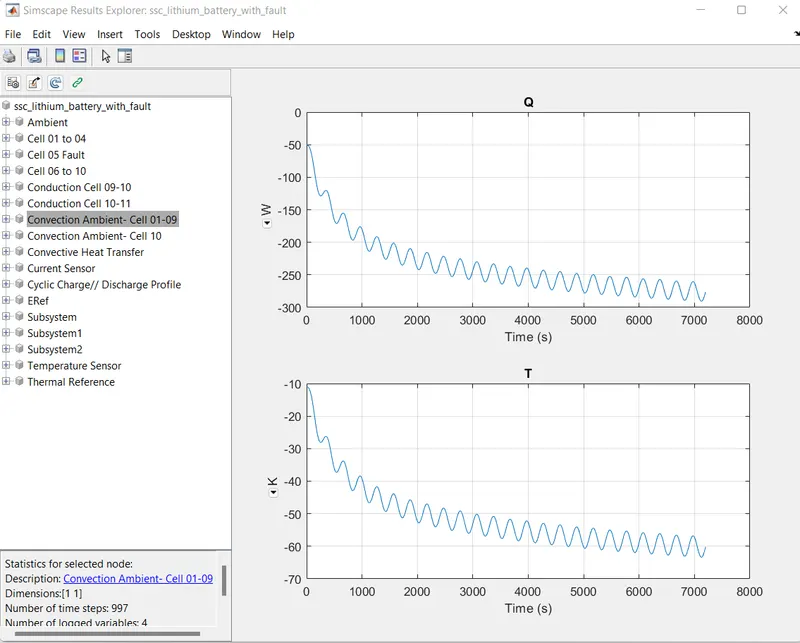
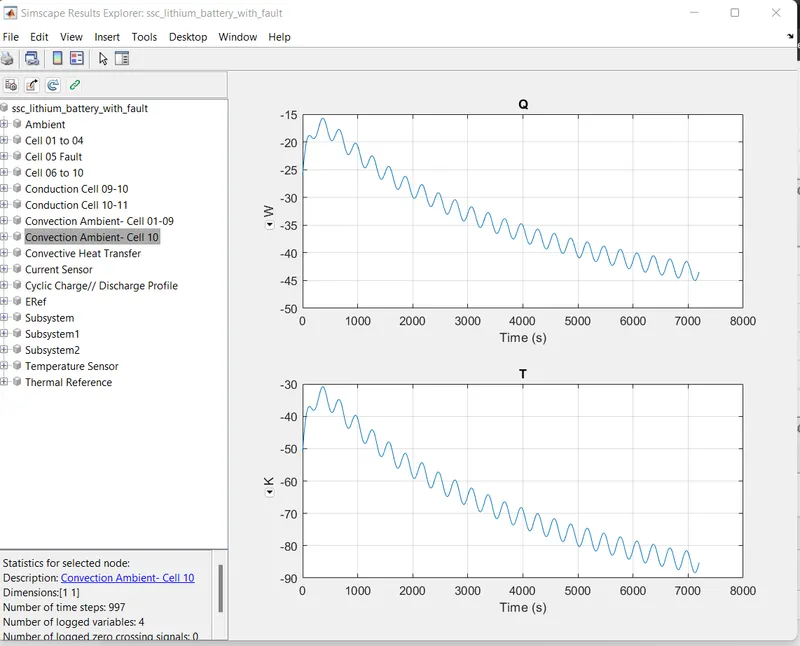
at this test condition cell no. 5 is kept at maximum temperature. cell no. 4 starts at an intial temperature of 310k , cell no.10 at 310k and cell no. 5 at 350k.
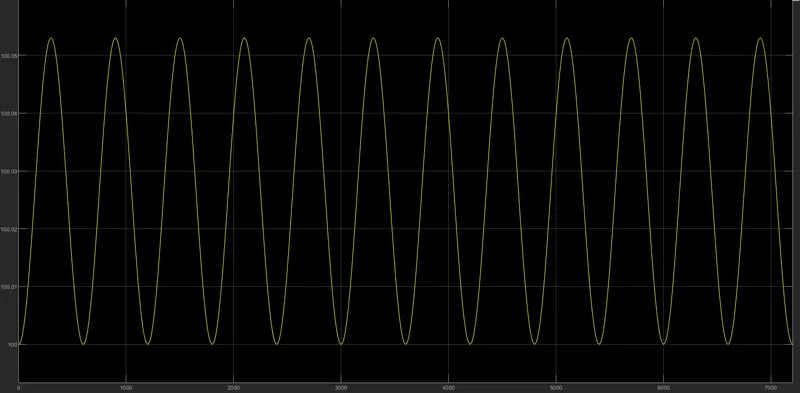
soc
conduction
Convection
SOC observation from all graphs .
the SOC observations do not change in the above test conditions with changes in ambient temperature. Besides this the SOC results are exactly as expected.with respect to the discrepancy between first, second and third battery pack this is attributed to the differences in temperature and electrical parameters. the second pack has been designed to go into fault due to its capacity, capacitance and open circuit voltage and increased terminal and cell resistances.
simulation results from simscape logging