Project 2 Thermal modeling of battery pack
Thermal modeling of battery pack.
1)For a 10 cell series lithium-ion battery model, simulate the thermal effects and compare life cycle performance at various temperatures, charge & discharge rates using MATLAB.
Following papers are used for reference of the work.
1. Tran, M.-K.; Fowler, M. A Review of Lithium-Ion Battery Fault Diagnostic Algorithms: Current Progress and Future Challenges. Algorithms 2020, 13, 62. https://doi.org/10.3390/a1303006
3. https://www.mathworks.com/help/physmod/simscape/ug/lithium-ion-battery-pack-with-fault.html
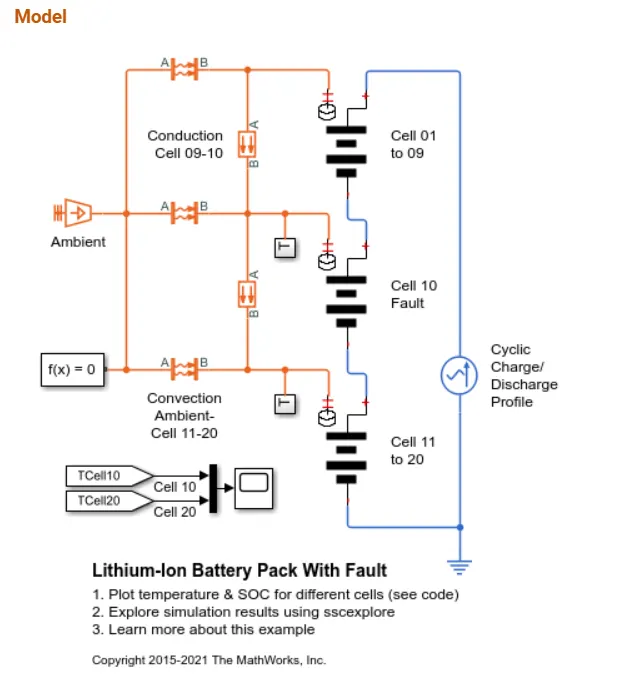
The Matlab model of 3. is an existing example which can be used to simulate performance of a battery pack. The original model is as follows.
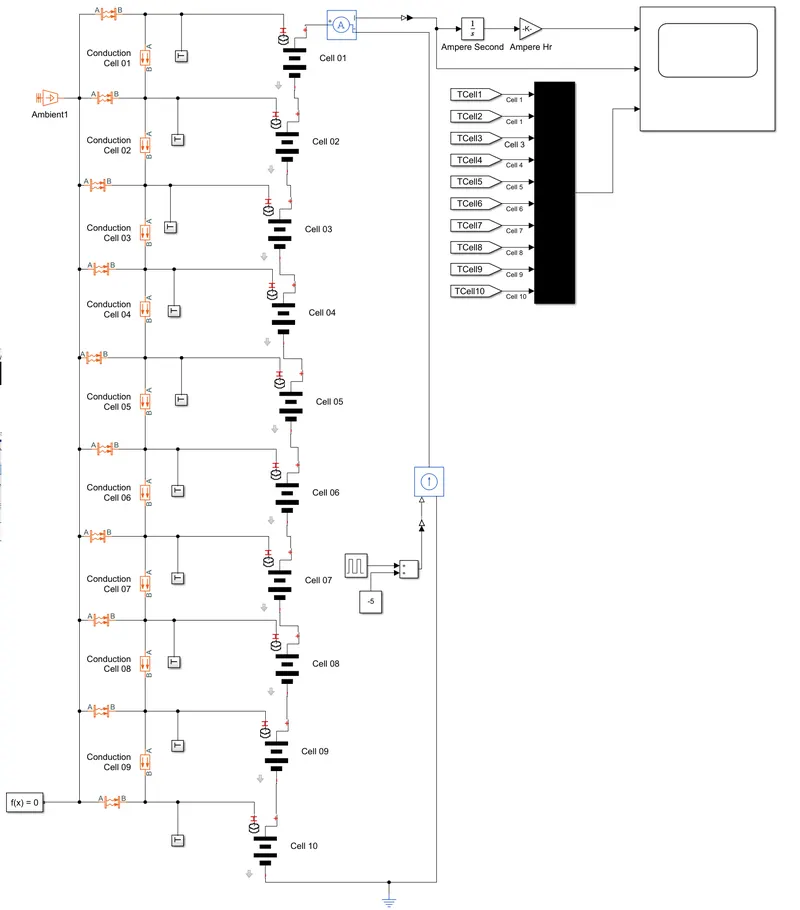
For our purpose, the model has been modiefied as following Thermal_Model_Control_Series.slx.
For initial control testing all cells are kept at same parameter.
the Circuit design is as follows.
10 lithium-ion battery cells are connected in series.
The heat transfer is observed between the packs by conduction and convection block which are modes of heat transfer.
T subsystem is attached in between every pack to plot the temperature graph of the cell of that particular battery pack.
The environment temperature will be controlled by Ambient1 Block.
The battery bank is connected to a discharge circuit which will discharge the pack at 10 A and charge at 5 A. Charge/Discharge Amps, and period is controllable.
Current, Temperature of all cell and Ah has been on display.
The output of the control test is as follows.
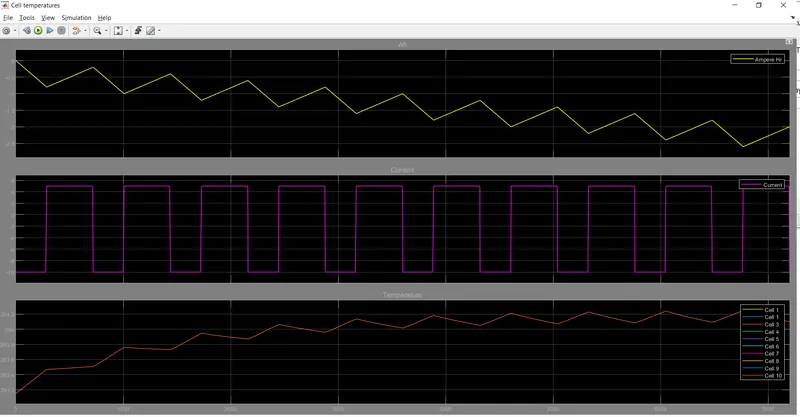
O_P_1.fig attached.
The models are designed as follows.
The basic block of the model is it's battery and subsequent temperature modules. For this, the cell model subsystems of the initial xample model is used. The subsystem is as follows.
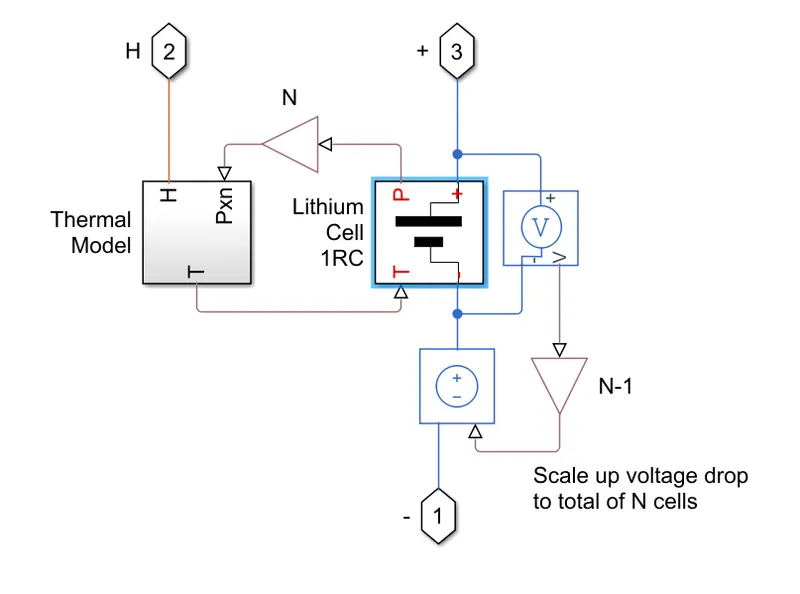
The cell subsytem consists of a thermal model and a lithium ion R-C block.
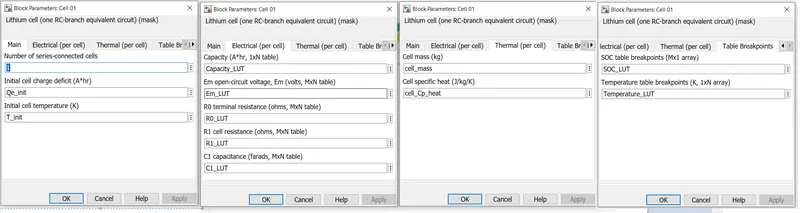
The R-C block, which acts as the cell is as follows,
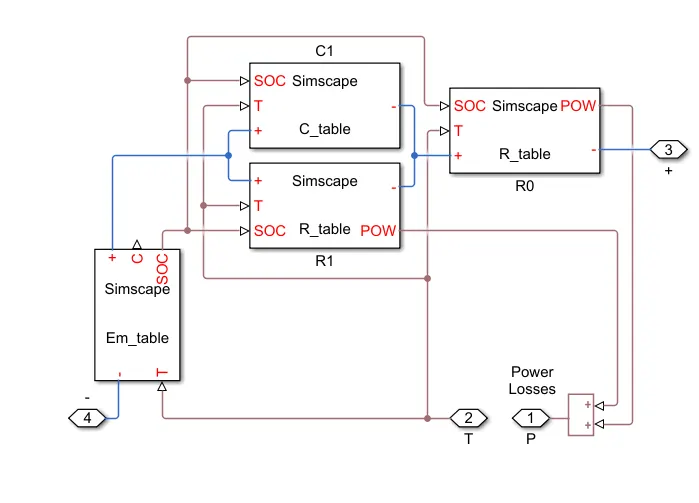
The model basically contains 4 lookup table with Cell Voltage(Em-table), Cell capacitor(C), Cell Internal resistance(R0, R1). These blocks, calculate the thermal effect on the battery based on the temperature and SOC.
Thermal Model,
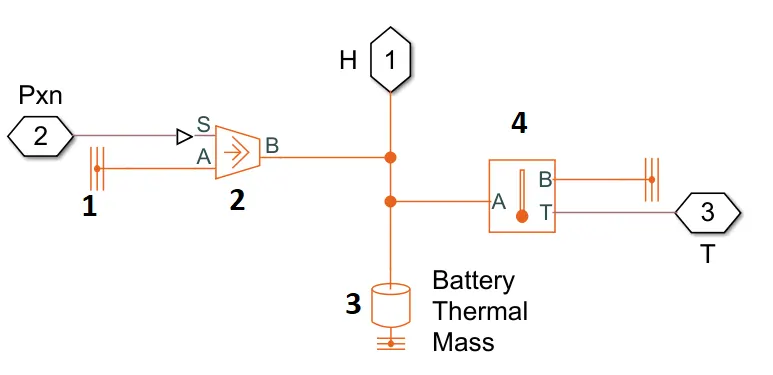
The thermal model consists of,
1. Thermal Reference, a point with an absolute zero temperature with reference to which all measurements and calculations were done.
2. Controlled Heat Flow Rate Source, this block represents an ideal energy source in a thermal network that can maintain a controlled heat flow rate regardless of the temperature difference. The heat flow rate is set by the physical signal port S. A positive heat flow rate flows from port A to port B.
3. Thermal Mass block, this block represents a thermal mass, which defines the ability of a material or a combination of materials to store internal energy. The thermal mass is described with the following equation:
Q=c·m*dT/dt
4. Temperature Sensor
The thermal block recieves the powerloss feedback from the RC block and based on that increases the temperature for the RC block.
The main circuit contains conductive and convective heat transfer blocks to allow temperature flow between batteries, so we can observe the effect of temperature in one block on others.
A heat source block is povided to simulate the effect of ambient temperature on the circuit.
The circuit has a current source to measure and calculate the current and Ah charged discharged.
A pulse generator, Constant block and controlled current source block will discharge and charge the circuit on regular interval.
Initial tests were done at ambient of 20 deg C.
To check the effect of temperature on the block, both blocks were tested at 0 deg and 80 deg C.
0 deg.
Series
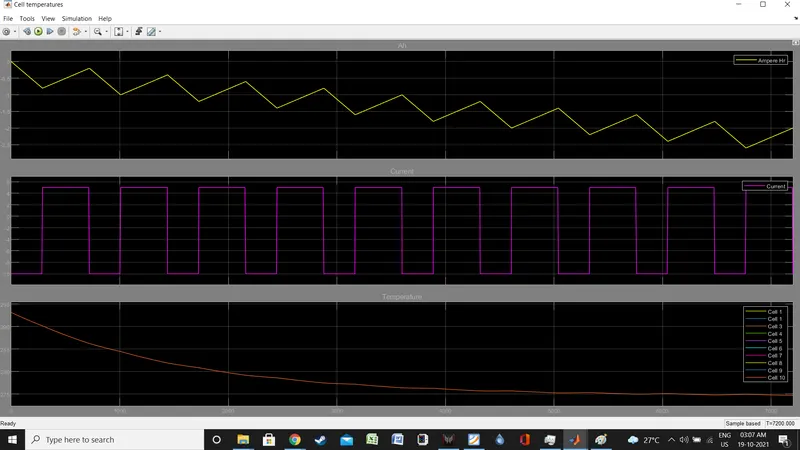
80 deg C
Series,
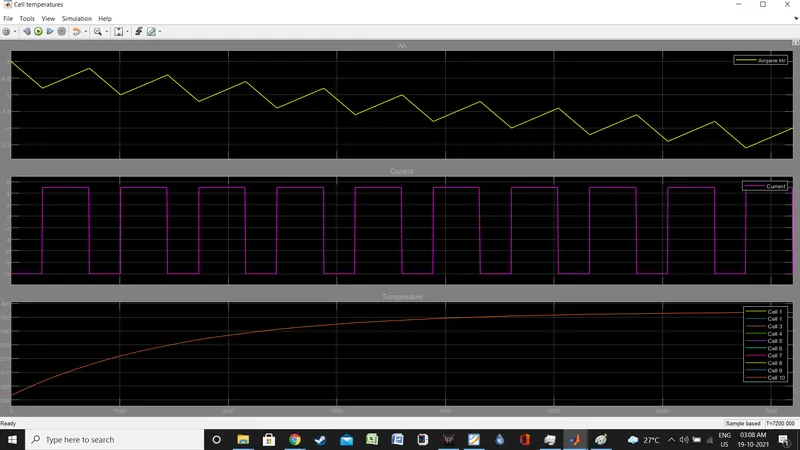
As it is seen, since all cells were at same condition. there is no temperature difference between them.
To test the temperature effects, we will cause one cell to be a diffective or faulty one and observes it's effect on others.
we will be using the following parameters for faulty cell.
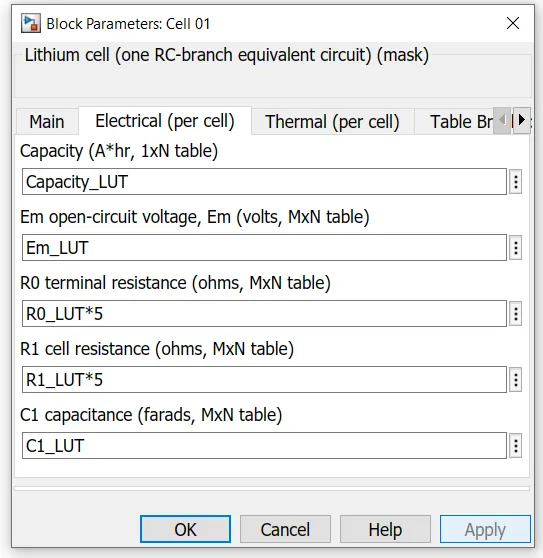
Test 1.
At 20deg C, Cell 1 faulty.
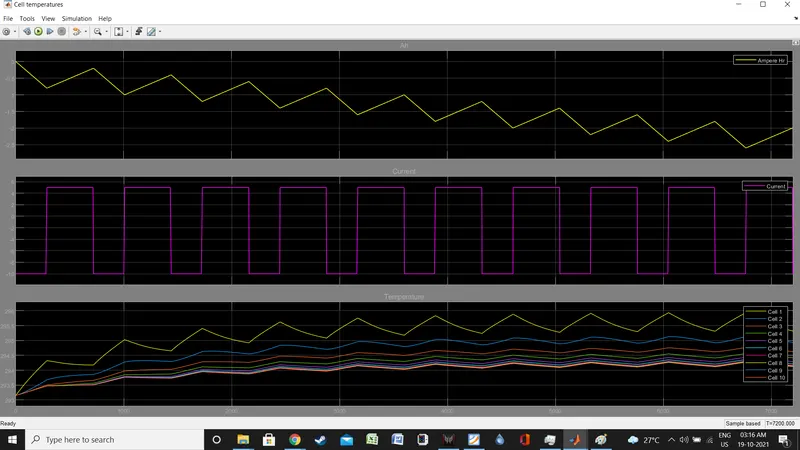
Test 2.
At 20deg C, Cell 10 faulty.
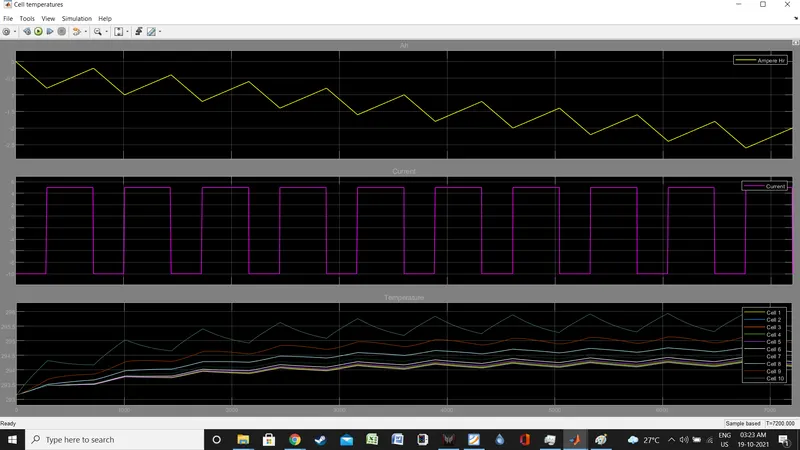
Test 3.
At 20deg C, Cell 5 faulty.
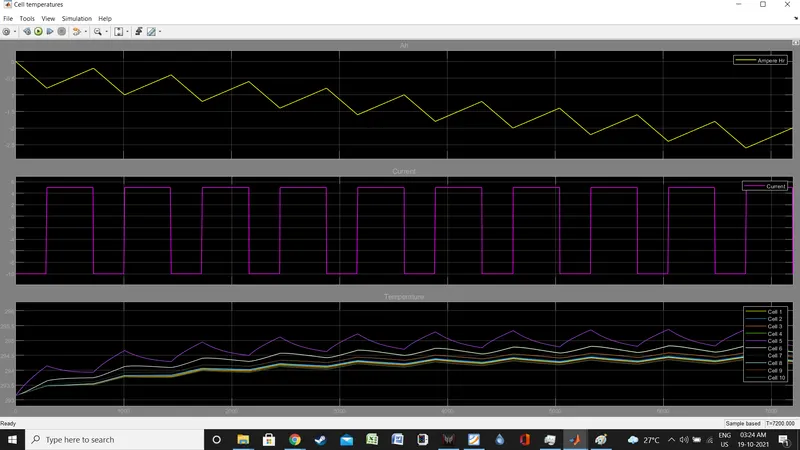
As it can be observed, that due to high resistance of the faulty cells, the temperature of the particular cell raises and it also increase the temperature of nearby cells.
Test 4,
at 20 deg C, charge discharge cycle for 3600 sec, ideal condition.
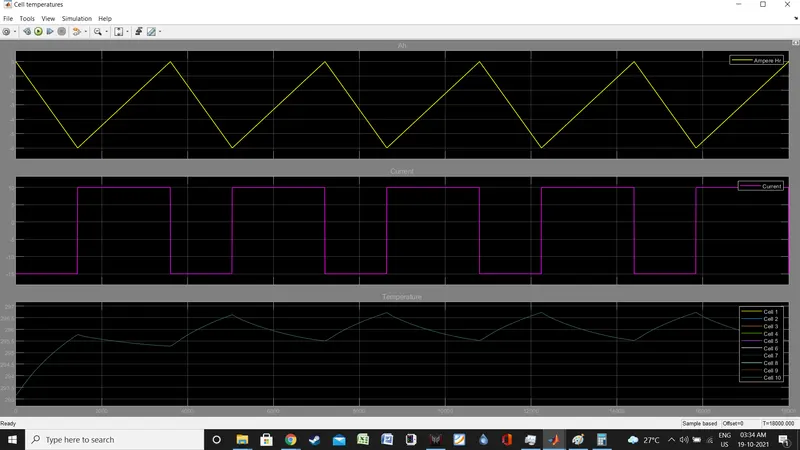
Test 4,
at 20 deg C, charge discharge cycle for 3600 sec, cell 5 faulty.
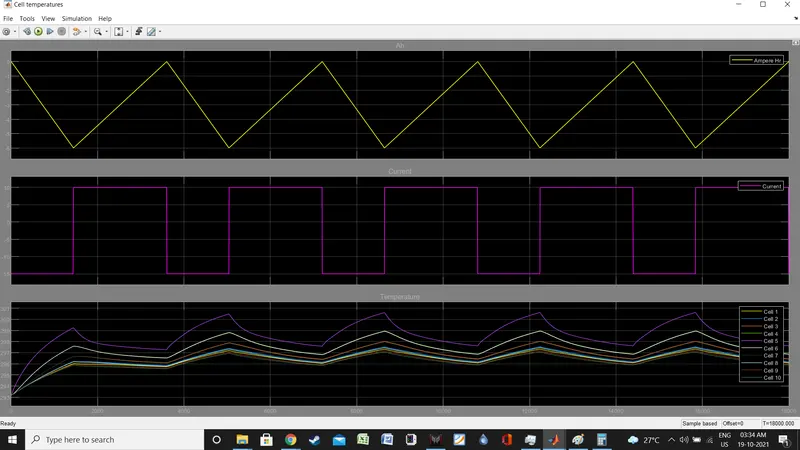
Conclusion:
This model can be used to study effect of faulty cells on whole bank. While the current model is unable to give any conclusive result of temperature on Ah and SOC, with more parameters and measured data, we can also define the effect of the same faulty cells on overall bank capacity.