Project 2 Thermal modeling of battery pack
Thermal modeling of battery pack
The lithium-ion batteries are widely used as energy sources in different hybrid and electric vehicle. The operation characteristics of the battery in such vehicle are strongly dependent on the operation temperature and therefore, with purpose to improve these characteristics a good thermal control system should be utilized.
The temperature of a lithium battery cell is important for its performance, efficiency, safety, and capacity and is influenced by the environmental temperature and by the charging and discharging process itself. Therefore, a thermal model of the battery is used in order to calculate and estimate the cell temperature.
Lithium-ion battery pack with fault was simulated. A battery pack consisting of multiple series-connected cells in an efficient manner. It also shows how a fault can be introduced into one of the cells to see the impact on battery performance and cell temperatures. For efficiency, identical series-connected cells are not just simply modelled by connecting cell models in series. Instead a single cell is used, and the terminal voltage scaled up by the number of cells. The fault is represented by changing the parameters for the cell 5 fault subsystem, reducing both capacity and open-circuit voltage, and increasing the resistance values.
Circuit:
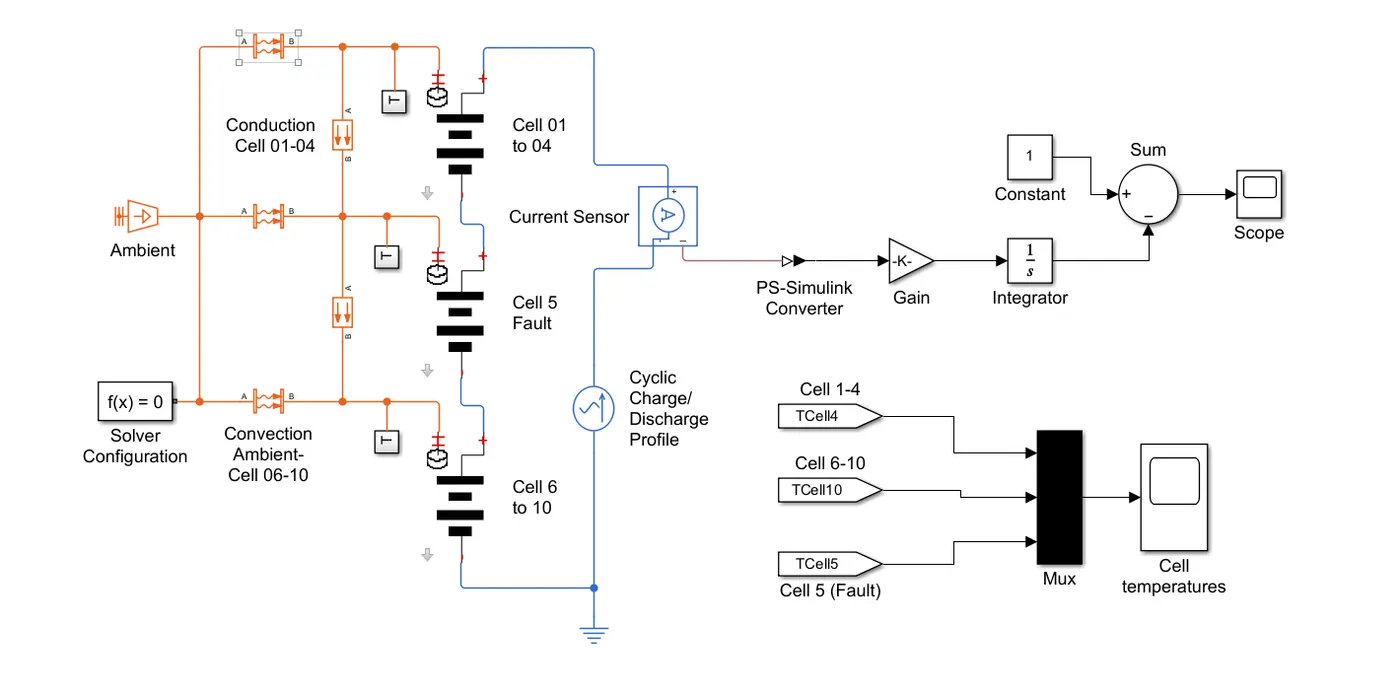
A detail design of MATLAB Simulink model for thermal modelling is given as:-
Cell 01 to 04 Subsystem:
Cell subsystem basically consist of a Thermal Model and Lithium Cell 1RC block which calculate the temperature and thermal effect for cells and overall calculate for the battery pack.
The block which are inside the cell subsystem are PS Gain block which multiplies the input physical signal by a constant i.e. y = u.* gain. Another block are voltage sensor and current voltage source.
The voltage sensor block represents an ideal voltage sensor, that is, a device that converts voltage measured between any electrical connections into a physical signal proportional to the voltage.
Current voltage source represents an ideal voltage source that is powerful enough to maintain the specified voltage at its output regardless of the current passing through it. The output voltage is V = Vs, where Vs is the numerical value presented at the physical signal port.
For cell 01 to 04
- Number of series-connected cells are 4
- Initial Temperature is 300, 320, 350 K respectively.
For cell 05 (fault setup) In this cell I have done some changes in Electrical system of cell so that we can see the fault.
- Number of series-connected cells are 1
- Initial Temperature is 299.1 K
- Capacity (A*hr) = Capacity_LUT*0.95
- Em open-circuit voltage (volts) = Em_LUT*0.9
- R0 terminal resistance (ohms) = R0_LUT*5
- R1 cell resistance (ohms) = R1_LUT*5
- C1 capacitance (farads) = C1_LUT*0.95
For cell 06 to 10
- Number of series-connected cells are 5
- Initial Temperature is 300, 320, 350 K respectively.
Here the output of one cell is connected with the SOC calculation whereas other output is connected with AC current source for cyclic charge/discharge profile.
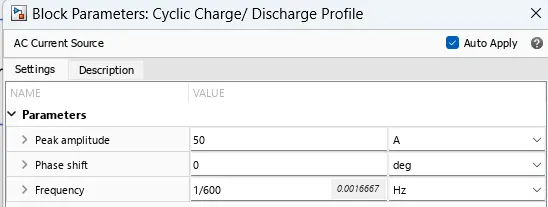
The peak amplitudes set to 50 A for cyclic charge and discharge. The ideal AC current source maintains the sinusoidal current through it, independent of the voltage across its terminals. The output current is defined by I = I0 * sin(2*pi*f*t + PHI), where I0 is the peak amplitude, f is the frequency in Hz, and PHI is the phase shift in radians.
Test:
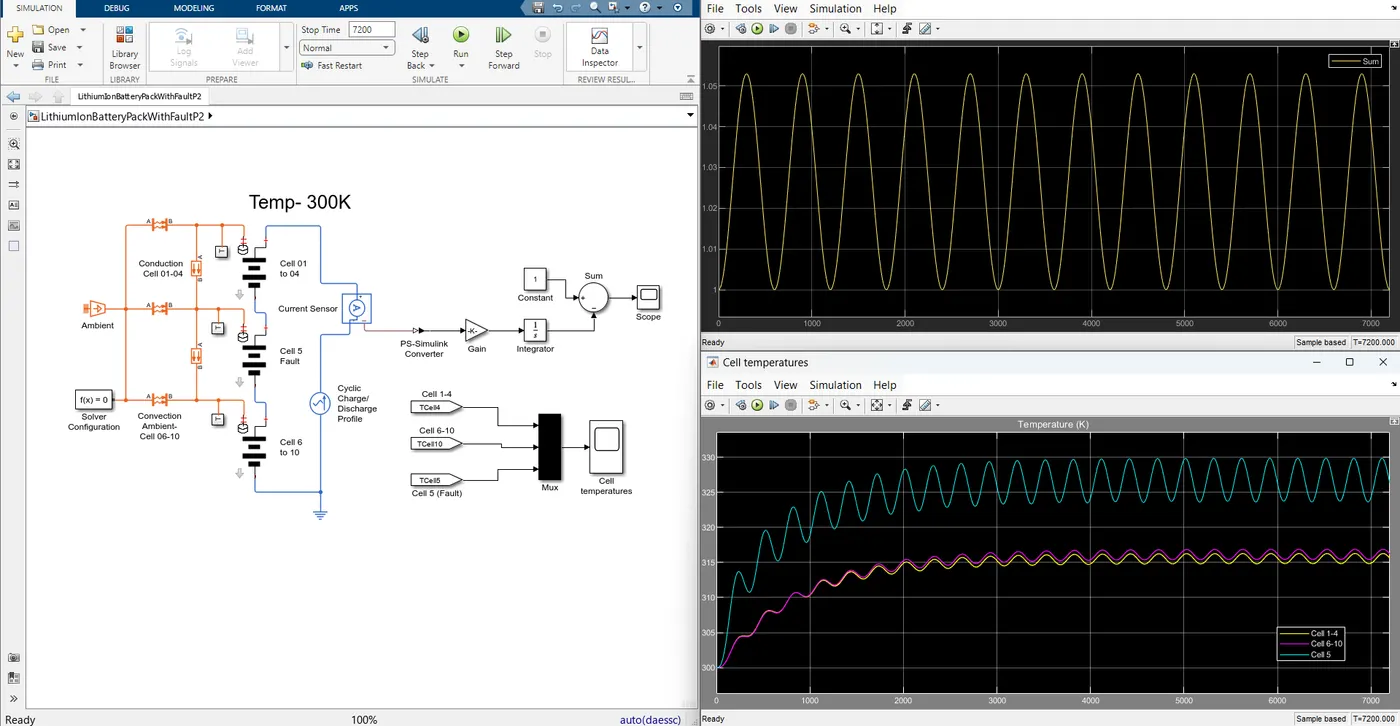
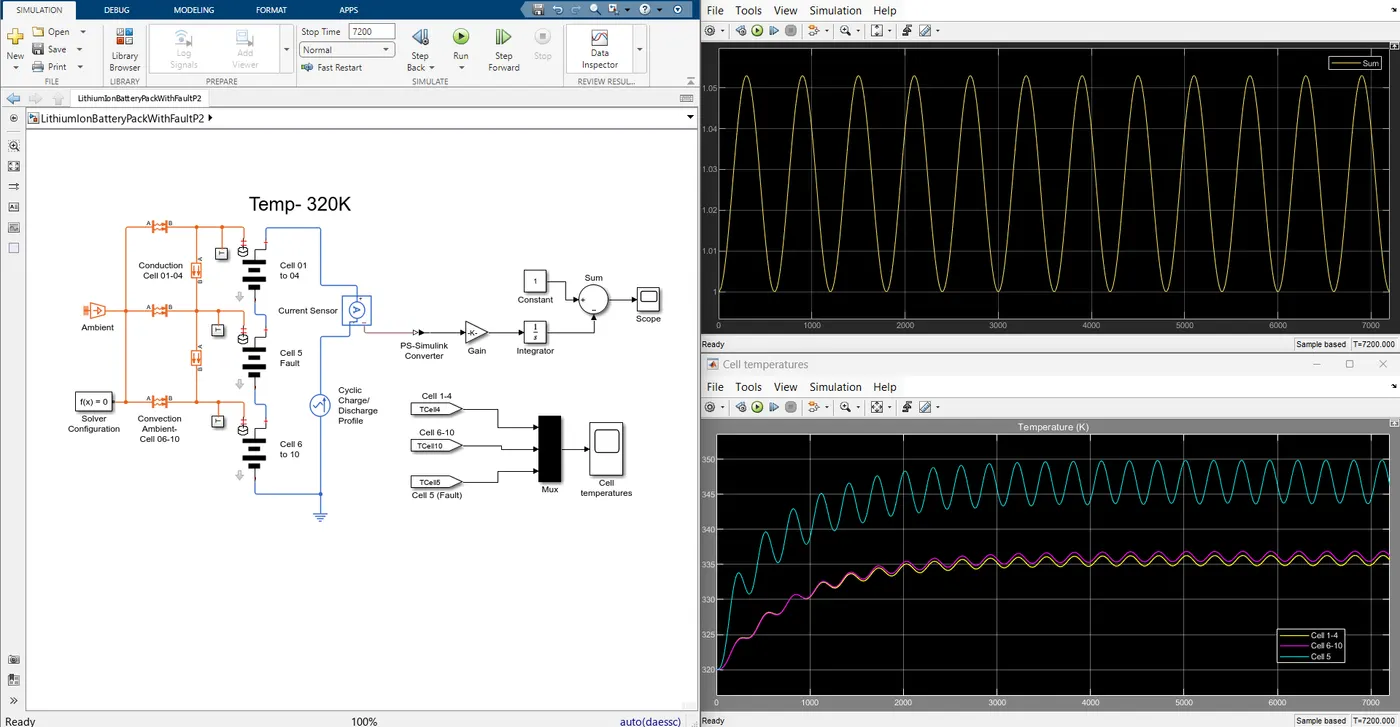
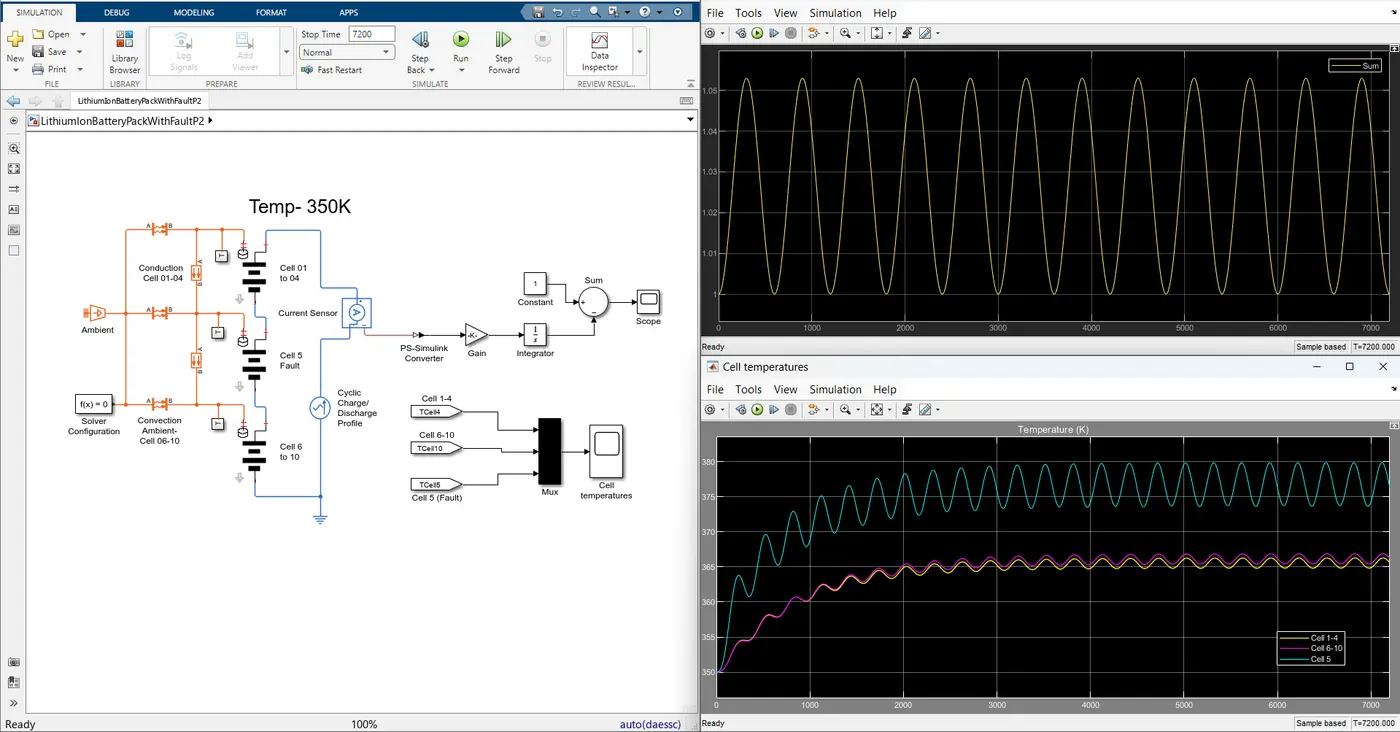
Comparative Analysis of the Battery Pack at Different Temperatures (300K, 320K, 350K)
1. Overview of the Battery Pack Model
- The simulation represents a Lithium-Ion Battery Pack with a Fault in Cell 5.
The pack consists of three groups of cells:
- Cell 1-4 (Regular operation)
- Cell 5 (Faulty)
- Cell 6-10 (Regular operation)
- The system is tested at three different temperatures: 300K, 320K, and 350K.
2. Summary of Cell Behavior at Different Temperatures
| Parameter | Cell 1-4 (Normal Cells) | Cell 5 (Faulty Cell) | Cell 6-10 (Normal Cells) |
|---|---|---|---|
| At 300K | Operates at a lower temperature range (~310K) with mild oscillations. | Higher temperature than normal cells (~315K), showing an increasing trend. | Slightly higher than Cell 1-4 (~312K), stable operation. |
| At 320K | Noticeable increase in temperature (~330K), still stable. | Higher than before (~335K), indicating a more pronounced effect of the fault. | Increases in temperature (~325K), but still similar behavior to Cell 1-4. |
| At 350K | Reaches ~355K, significant temperature rise but stable performance. | The faulty cell reaches its highest temperature (~365K), showing the most deviation. | Higher temperatures (~360K), following the increasing trend of the system. |
3. Analysis of the Sum and Cell Functioning at Different Temperatures
| Aspect | 300K | 320K | 350K |
|---|---|---|---|
| Sum Graph Trend | Shows a stable oscillation pattern with low amplitude. | The sum increases with a similar oscillation trend but with a higher average value. | The highest oscillation amplitude and sum value, indicating a strong temperature effect. |
| Faulty Cell Impact | Cell 5 is already at a higher temperature but does not cause immediate instability. | The fault impact increases, causing higher deviations in temperature compared to normal cells. | The faulty cell has the largest deviation, potentially leading to overheating risks. |
| Overall Pack Health | Pack remains stable with normal fluctuations. | Increased temperatures across all cells, but the system still functions normally. | The system is under high thermal stress, which may lead to safety concerns if temperatures rise further. |
4. Key Findings and Observations
-
Temperature Rise Effect
- Higher ambient temperature leads to higher internal temperatures for all cells.
- The faulty cell (Cell 5) exhibits more pronounced heating, which may be a critical failure risk at higher temperatures.
-
Impact on Sum (Overall System Behavior)
- The sum value increases with temperature, indicating an overall higher thermal load on the system.
- Oscillations remain consistent, but their amplitude increases, meaning temperature swings are more extreme at higher temperatures.
-
Risk of Thermal Runaway
- At 350K, Cell 5 shows the most extreme rise, making it the weakest link in the battery pack.
- If this trend continues at even higher temperatures, thermal runaway might occur, leading to potential battery failure.
5. Conclusion and Recommendations
- At 300K → The system remains stable with controlled oscillations.
- At 320K → The faulty cell begins showing more temperature deviation.
- At 350K → The system operates at a higher risk level, requiring better thermal management strategies to prevent failure.
6. Charge and Discharge Behavior Analysis:
6. Charge and Discharge Behavior Analysis:
- The sum graph in all three images exhibits a repeating oscillatory pattern, meaning the system undergoes periodic charge and discharge cycles.
- The frequency and amplitude of the oscillations remain similar across different temperatures, implying a constant charge and discharge rate.
- Since the temperature variation increases with higher ambient temperature (300K → 350K), it suggests that the battery experiences higher energy dissipation at elevated temperatures.