Project 2 Thermal modeling of battery pack
Aim: Creating a 10-cell series lithium-ion battery model, simulate the thermal effects and compare life cycle performance at various temperatures, charge & discharge rates using MATLAB.
Objective: To model and simulate 10 cell in series lithium ion battery pack, analyse the thermal effects and compare its life cycle performance at various temperatures, charge & discharge rates using MATLAB.
The performance and life-cycle costs of electric vehicles (EV) and hybrid electric vehicles (HEV) depend inherently on energy storage systems such as batteries. Battery pack performance directly affects the all-electric range, power for acceleration, fuel economy, and charge acceptance during energy recovery from regenerative braking. Because the battery pack cost, durability, and life also affect the cost and reliability of the vehicle, any parameter that affects the battery pack must be optimized.
Why we need to thermal management in battery?
The battery pack may experience heat generation in many ways such as high C rate for charging and discharging, High cell temperature due to short circuit, High atmospheric temperature, High Internal resistance etc.,
Below are common factors that will improve the battery life when considering the thermal management technique in our battery design.
Safety: Exposing a battery to extreme temperatures can be dangerous. For example, operating a battery at temperatures above 80°C can cause thermal runaway, which can lead to fire or explosion.
Performance: Batteries perform best when they operate within a certain temperature range. Manufacturers prefer batteries to operate between 15°C and 35°C.
Lifespan: Thermal management can help to extend the battery's lifespan.
Connection of Cells:
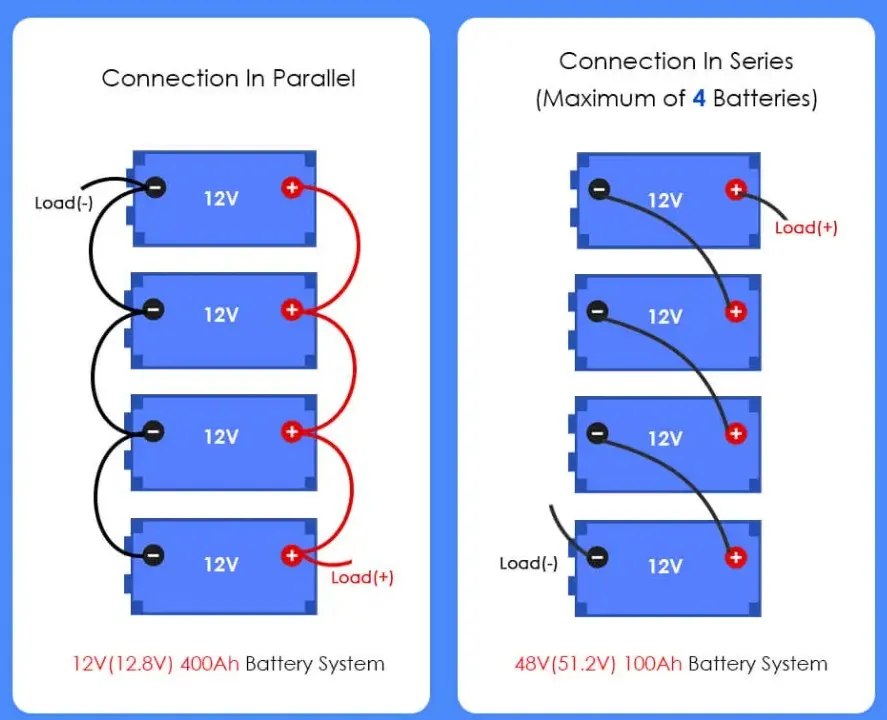
Series Connection:
Increases voltage, but not capacity. In a series connection, the negative terminal of one battery is connected to the positive terminal of another, and so on. The total voltage of the battery system is the sum of the voltage potentials of each cell.
Parallel Connection:
Increases capacity, but not voltage. In a parallel connection, batteries are connected positive-to-positive. The total voltage of the battery system remains the same, but the amp-hour capacity is the sum of the capacities of each battery.
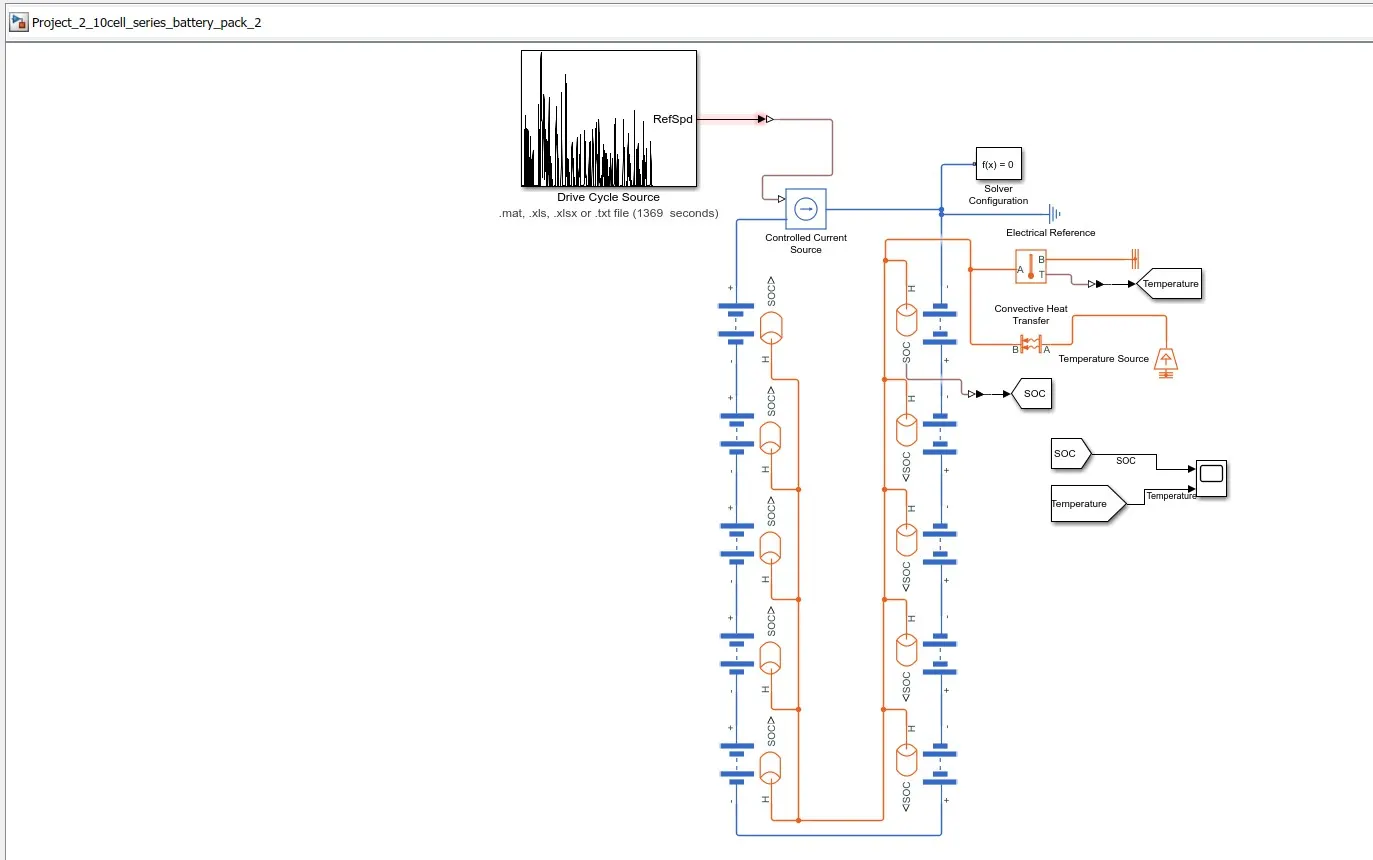
To simulate the thermal effects and compare the life cycle performance of a 10-cell series lithium-ion battery pack at various temperatures, charge rates, and discharge rates using MATLAB below Simulink model is created.
Battery (Table-Based) Model:
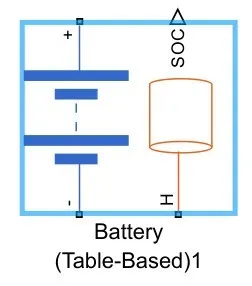
This block models the electro-thermal dynamics of a battery by using electrical circuit elements with variable characteristics and a zero-dimensional lumped-mass thermal heat equation. Lookup tables or empirical relationships can be used to model cycling (fade) and calendar aging of the battery. The block tabulates the variable characteristics of the electrical circuit elements as functions of the state of charge of the battery and, optionally, temperature.
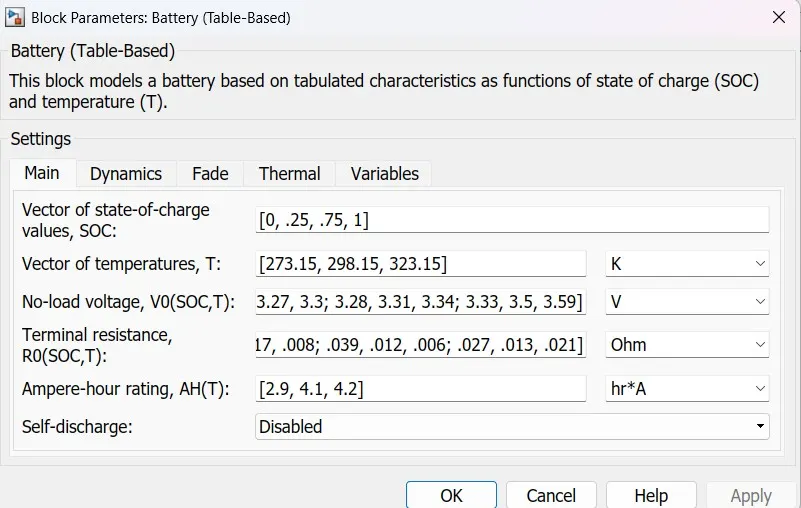
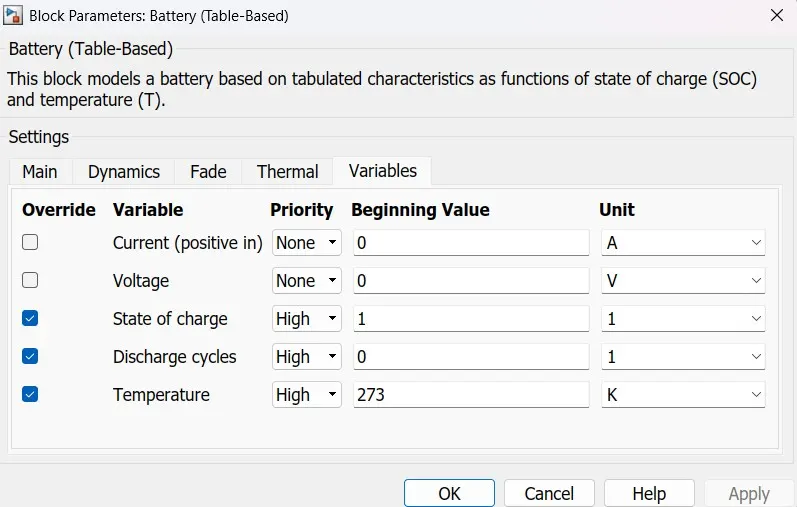
Block Parameters:
Drive Cycle:
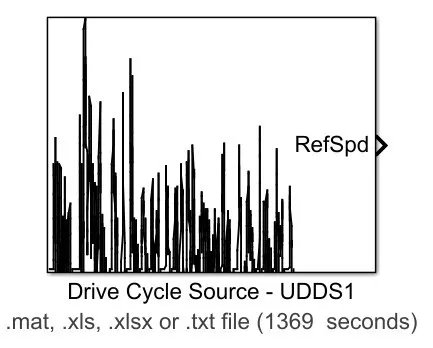
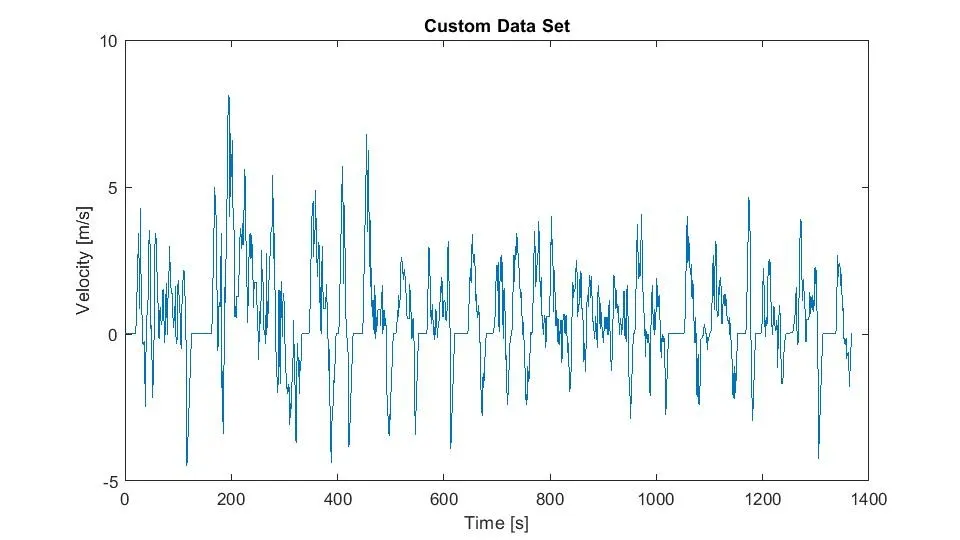
UDDS stands for Urban Dynamometer Driving Schedule which refers to a United States Environmental Protection Agency mandated dynamometer test on fuel economy that represents city driving conditions which is used for light duty vehicle testing.
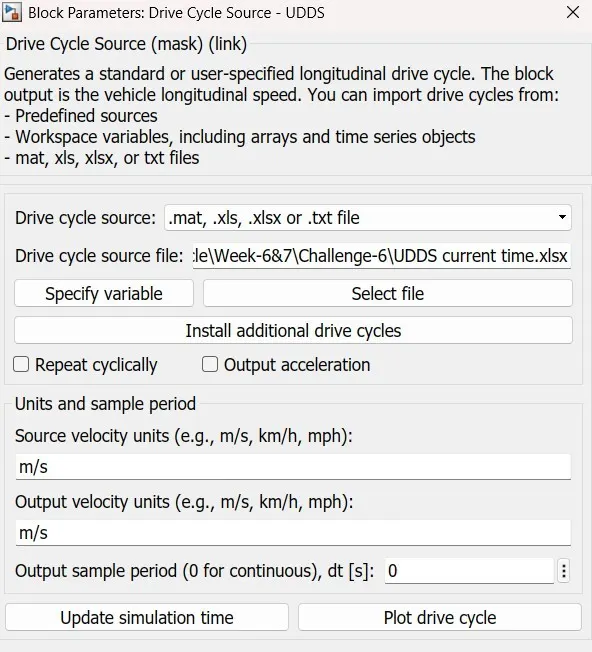
Drive Cycle Block for Generating UDDS Drive cycle:
# Drive Cycle block parameter
# Drive Cycle Plot Graph
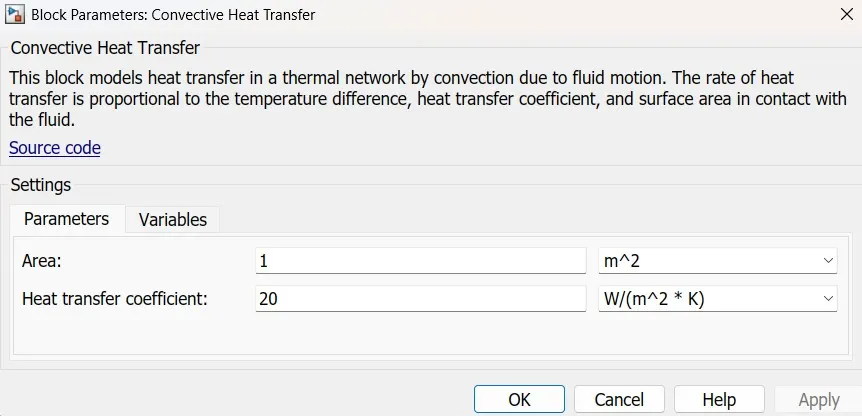
Convective Heat Transfer:
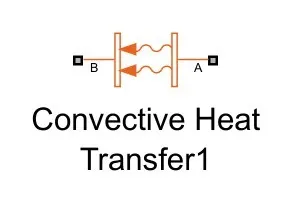
The Convective Heat Transfer block represents a heat transfer by convection between two bodies by means of fluid motion. The transfer is governed by the Newton law of cooling and is described with the following equation: Q = k*A*(Ta – Tb)
Were, Q Heat
flow, k Convection heat transfer coefficient, A Surface area
Ta, Ta Temperatures of the bodies.
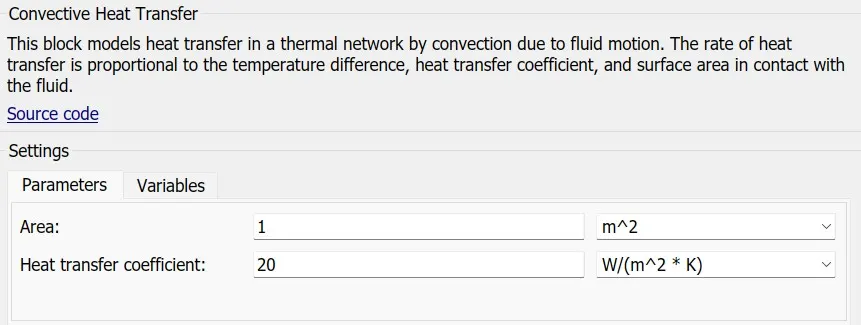
This block models heat transfer in a thermal network by convection due to fluid motion. The rate of heat transfer is proportional to the temperature difference, heat transfer coefficient, and surface area in contact with the fluid. The heat transfer coefficient can be either constant or variable. When the heat transfer coefficient is variable, specify it using the physical input signal at port K. If the heat transfer coefficient is variable, it remains at the Minimum heat transfer coefficient if the physical signal falls below this value.
Parameter:
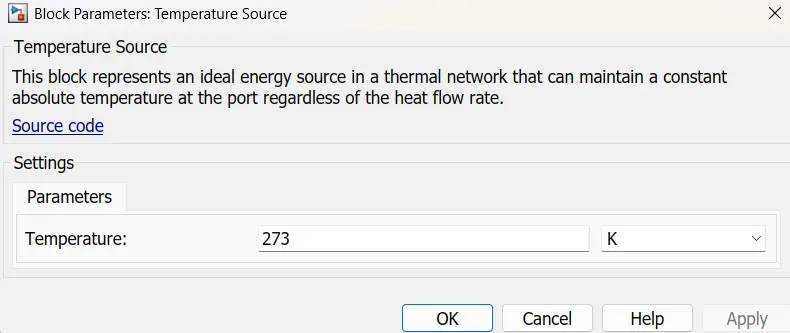
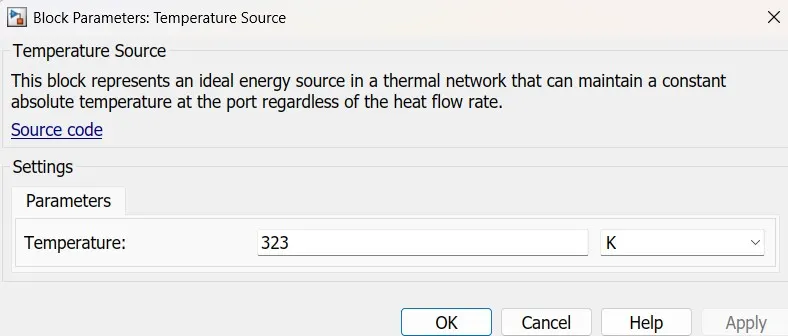
Temperature Source:

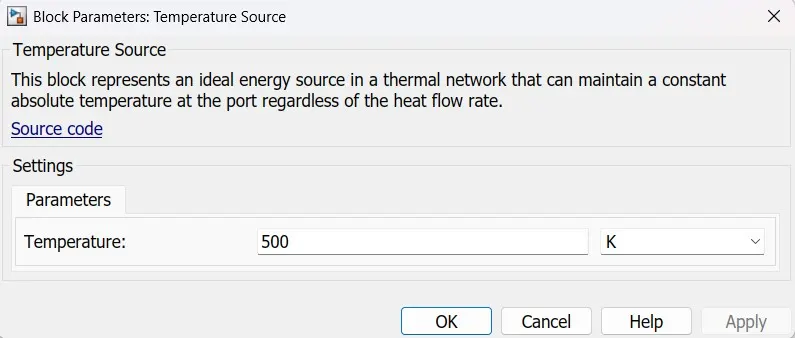
This block represents an ideal energy source in a thermal network that can maintain a constant absolute temperature at the port regardless of the heat flow rate.
Parameter:
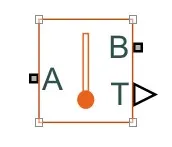
Temperature Sensor:
Description:
The Temperature Sensor block represents an ideal temperature sensor, that is, a device that determines the temperature differential measured between two points without drawing any heat.
Connections A and B are thermal conserving ports that connect to the two points where temperature is being monitored. Port T is a physical signal port that outputs the temperature differential value.
The block positive direction is from port A to port B. The measured temperature is determined as T = Ta – Tb.
Ports:
The block has the following ports:
A - Thermal conserving port associated with the sensor positive probe.
B - Thermal conserving port associated with the sensor negative probe.
T - Physical signal output port for temperature.
Controlled Current Source:
For Discharge the battery with some constant discharge current
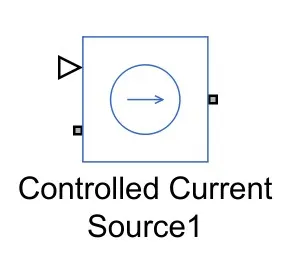
The block represents an ideal current source that is powerful enough to maintain the specified current through it regardless of the voltage across it. The output current is I = Is, where Is is the numerical value presented at the physical signal port.
Thermal reference:
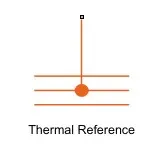
This block represents a reference point in a thermal network where the temperature is equal to absolute zero.
Electrical Reference:
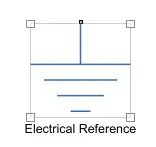
Electrical reference port. A model must contain at least one electrical reference port (electrical ground).
Simulink Model: 10 cell series lithium-ion battery pack
Explanation of Model:
- The Simulink model is built to simulate the thermal effects and compare life cycle performance at various temperatures, charge & discharge rates in the battery's performance.
- Therefore, a temperature source (Thermal system) is connected to the Battery system. This temperature source is connected to the battery through Connective Heat Transfer; hence the temperature and the area of contact can vary through them and parallelly the battery performance.
- 10 table-based battery is connected in series in the below model. SOC port and thermal port are enabled for the battery and are connected to a Scope and the thermal setup consists of a temperature source, Convective Heat transfer, temperature sensor, and a Thermal Reference.
- Drive Cyle block is used as an input current signal for the circuit. It'll act as a C-rate (discharge) for the battery.
- A Controlled Current Source block is connected between drive cycle block and the battery. This block represents an ideal current source for the battery. An Electrical reference block and a Solver Configuration block are also connected as this model is made using Simscape blocks.
- At the thermal side, all the 10 batteries' thermal ports are connected to a common port signal which is then connected to the thermal system of the model.
- A Temperature Source block is connected to the thermal port of the battery with the help of a Convective Heat Transfer. It is used to transfer the heat to the battery. Using a temperature source, temperature value can be modified and through Convective Heat Transfer area of contact kept constant, and the impact can be seen in the battery performance.
- A Scope block is connected to both the SOC port and thermal port signals to display the output. PS-Simulink Converter blocks are used to connect Simscape blocks to the Simulink blocks.
Output:
# Simulation results for below temperature source - 1
Temperature - 273k, Area of contact - 1 m2
Scope Result:
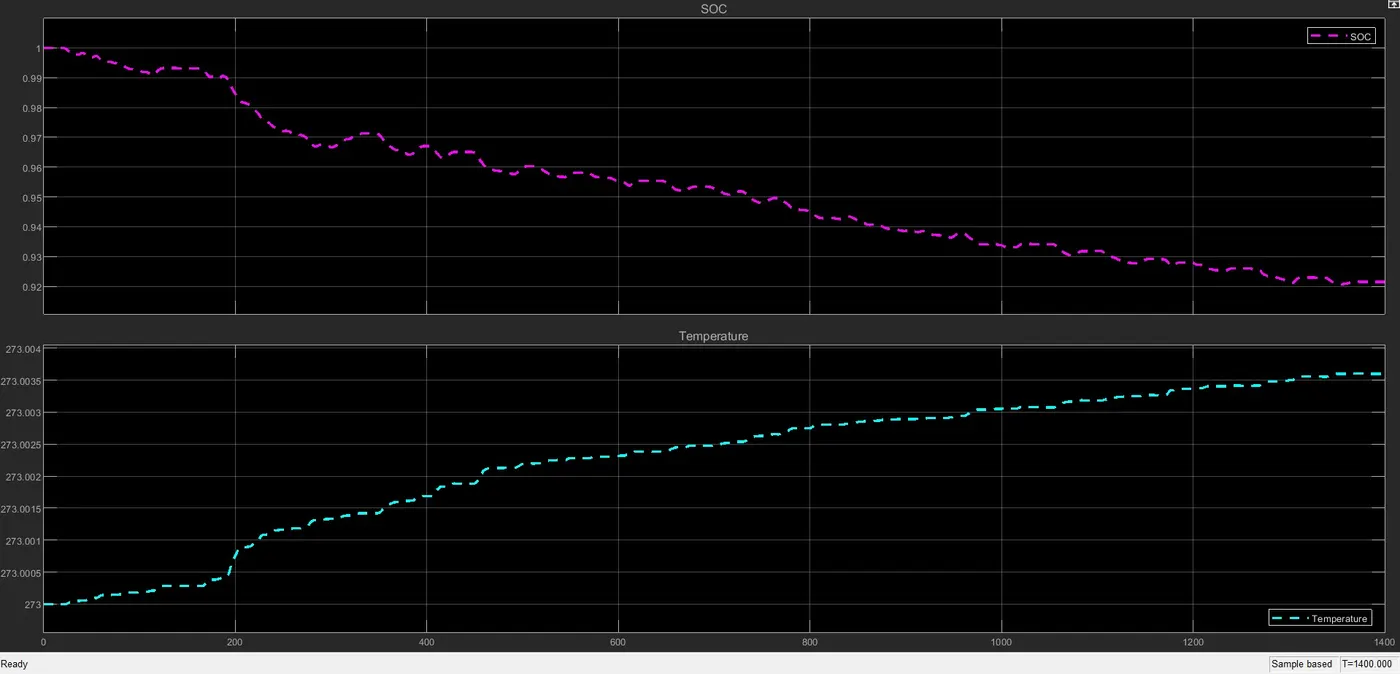
- The first graph is of soc which is in the decreasing form but in linear, it is some time charging and some time it is discharging as per the current goes positive or negative.it starts from 1 which is full charge after the whole simulation time (i.e. – 1400 Sec) it is at 0.92 which is aproxx full.
- Third graph is Temperature which is 273K, This is less than the ambient temperature 293k, we could see there is no more effect in temperature of the pack.
# Simulation results for below temperature source - 2
Temperature - 323k, Area of contact - 1 m2 (same as previous)
Scope Result:
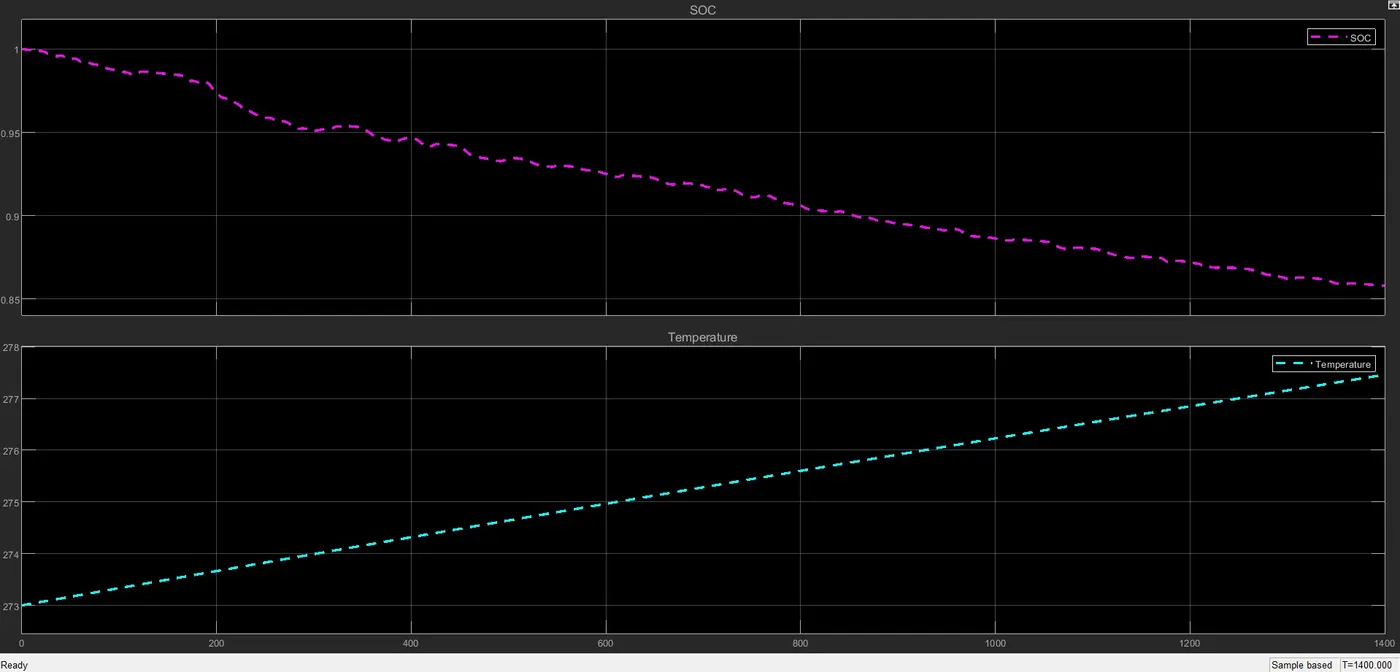
- The first graph is of soc which is in the decreasing form but in linear, it is some time charging and some time it is discharging as per the current goes positive or negative.it starts from 1 which is full charge after the whole simulation time (i.e. – 1400 Sec) it is at 0.86
- The second graph which is temperature with respect to time here it is changed like first it starts from 273k and it increases up to 277.5k over the span of 1400 sec. So we could see much difference than previous temperature source setting of the battery pack.
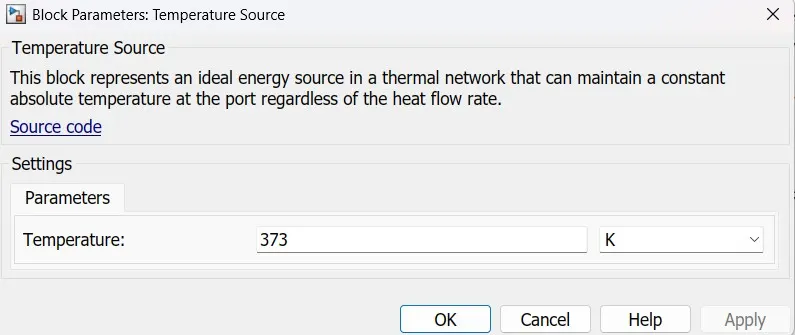
# Simulation results for below temperature source - 3
Temperature - 373k, Area of contact - 1 m2 (same as previous)
Scope Result:
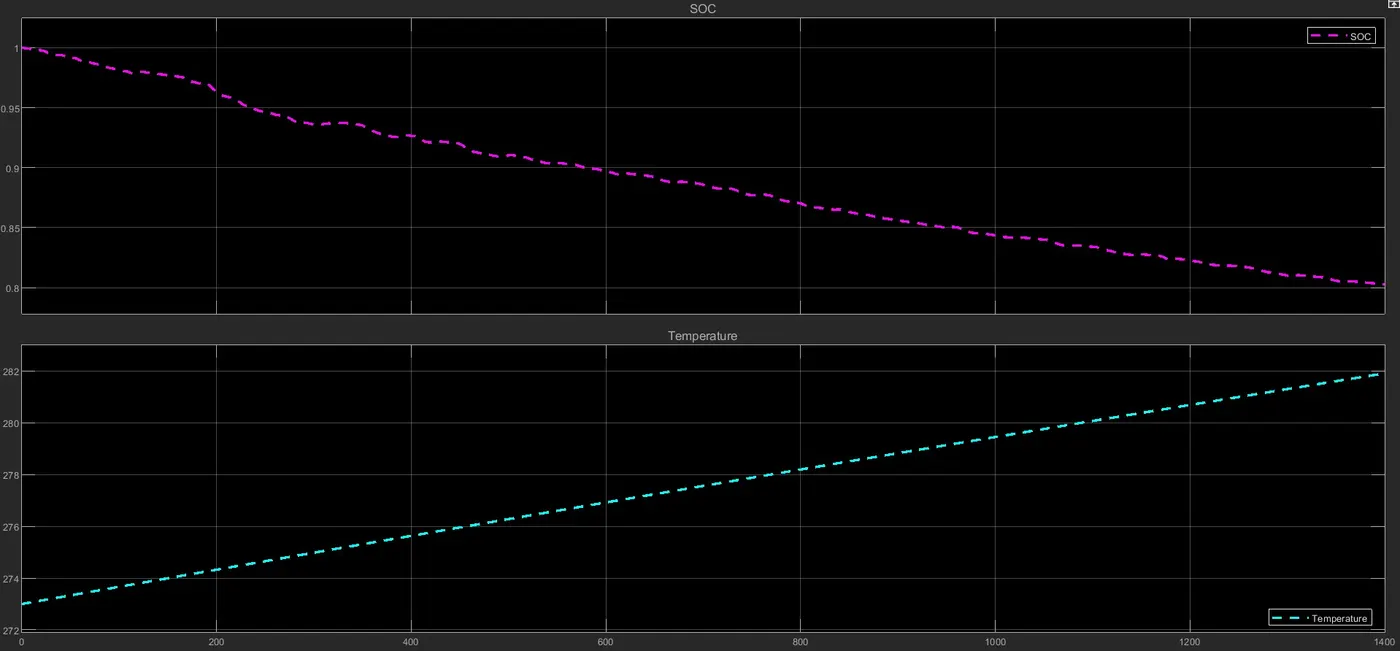
- The first graph is of soc which is in the decreasing form but in linear, it is some time charging and some time it is discharging as per the current goes positive or negative.it starts from 1 which is full charge after the whole simulation time (i.e. – 1400 Sec) it is at 0.80
- The second graph which is temperature with respect to time here it is changed like first it starts from 273k and it increases up to 282k over the span of 1400 sec. So we could see much difference than previous temperature source setting of the battery pack.
# Simulation results for below temperature source - 4
Temperature - 500k, Area of contact - 1 m2 (same as previous)
Scope Result:
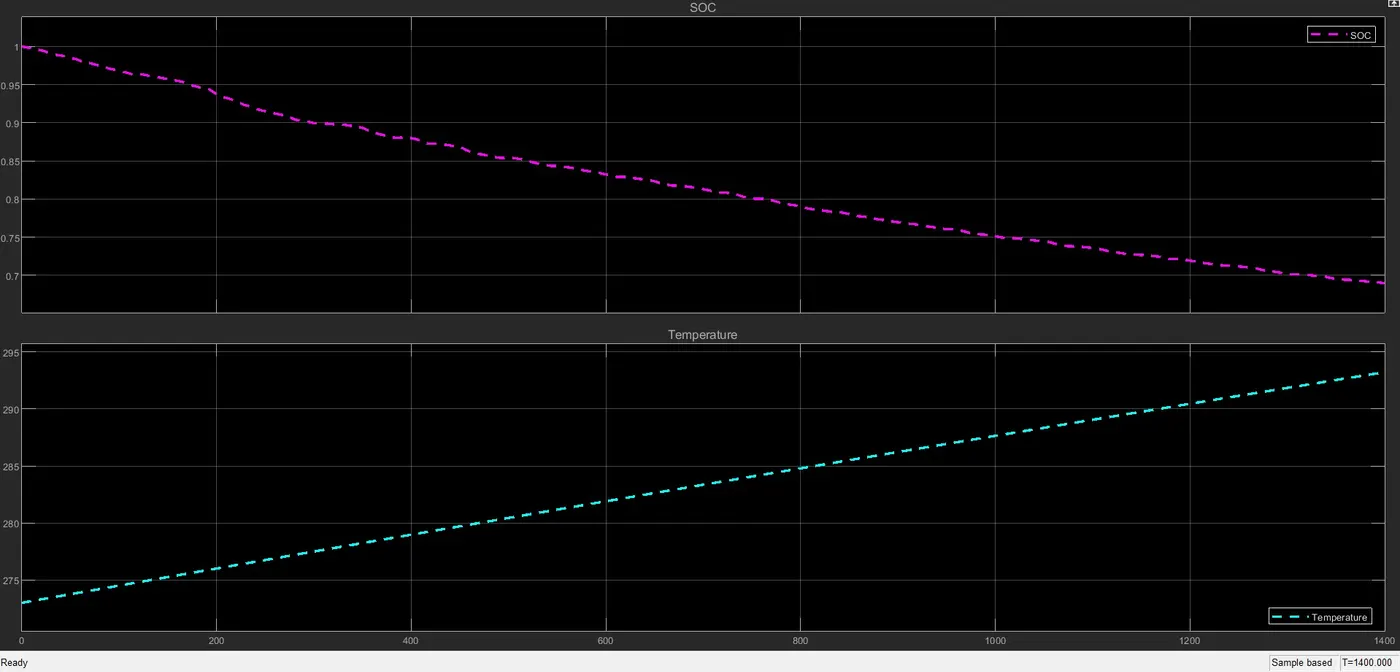
- The first graph is of soc which is in the decreasing form but in linear, it is some time charging and some time it is discharging as per the current goes positive or negative.it starts from 1 which is full charge after the whole simulation time (i.e. – 1400 Sec) it is at 0.70
- The second graph which is temperature with respect to time here it is changed like first it starts from 273k and it increases up to 293k over the span of 1400 sec. So we could see much difference than previous temperature source setting of the battery pack.
Comparing the performance of 10cell series connection battery pack for different temperatures:
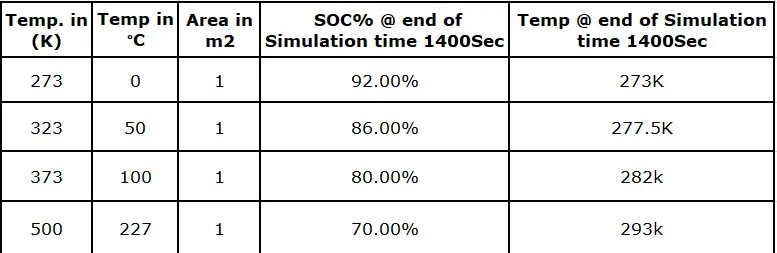
As we can see, with the rise in temperature, the SOC decreases which means that if we operate the battery at a high temperature than the rated temperature then the battery will discharge fast and the life of the battery will decrease accordingly. And also temperature of the battery pack is increased when temperature source increases.
Conclusion:
- The thermal effects of the battery pack during cycling charging and discharging have been analysed and plotted at various ambient temperatures.
- As you can see, the SOC reduces as temperature rises, meaning that if we operate the battery at a higher temperature than the rated temperature, the battery will discharge quickly and its life will decrease as a result.
- The amount of time needed to reach the desired temperature will decrease as the surface area in contact with convective heat transfer rises.
- Above study will help the battery pack manufacturer to design the battery thermal management to improve the battery efficiency.