Project 2 Thermal modeling of battery pack
Objective:- For a 10 cell series lithium ion battery model, simulate the thermal effects and compare life cycle performance at various temperatures, charge & discharge rates using MATLAB.
Simulink Model:-
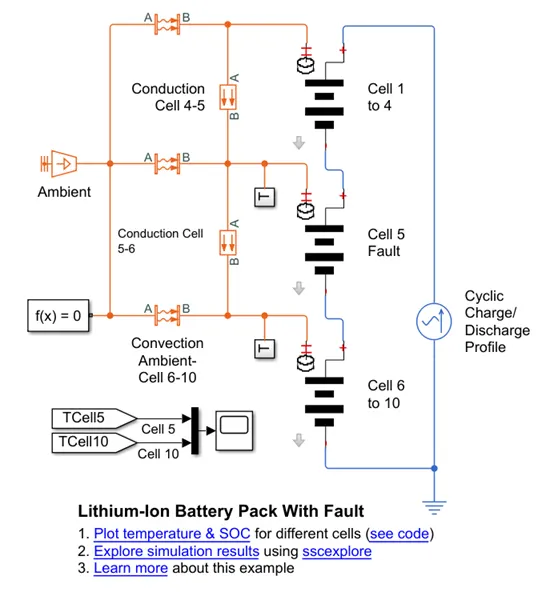
Explaination:-
Temperature Source

Constant source of thermal energy, characterized by temperature. Here this block represents the Ambient Temperature
Convective Heat Transfer

The Convective Heat Transfer block represents a heat transfer by convection between two bodies by means of fluid motion.
The block here represents the heat transferred to the cells due to convection, i.e here the medium is air. This block is connected to ambient temperature
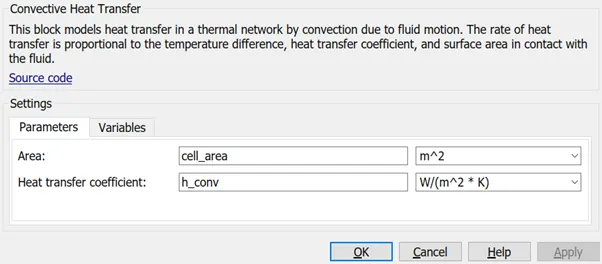
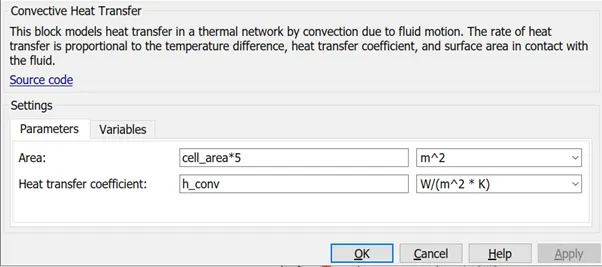
Below is the Convective Heat Transfer table for all cells
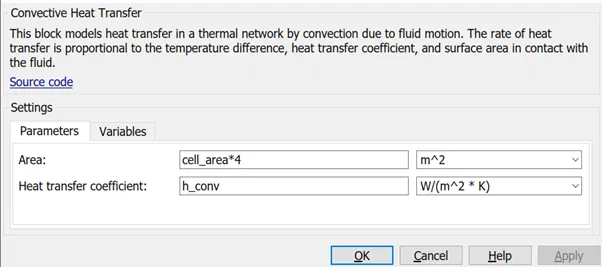
Here the Area of the Cell is multiplied by 4, since there are 4 number of cells
Here the Area of the Cell is multiplied by 5, since there are 5 number of cells
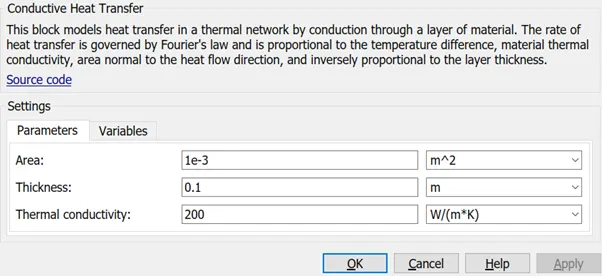
Conductive Heat Transfer
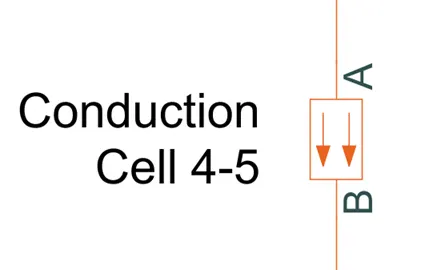
This block represents Heat transfer by conduction. Here the Conduction Heat transfer is in between the Cells 4 & 5
Below is the Conductive Heat Transfer Table
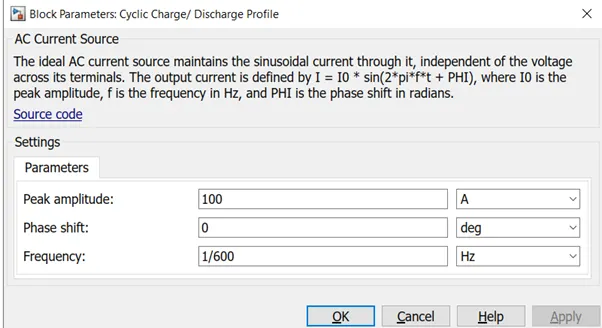
AC Current Source

Here we will use an AC current source block to charge and discharge the cells. To perfrom this task we have to assign a very low frequency so that its Time period increases. As the Time Period increase, the charging and discharging of the cells also increases
Below is the Table of AC current source and parameters allotted. Here the Frequency is set to 1/600
Temperature sensor
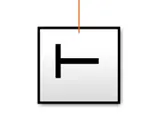
Below is the inside view of the Temperature sensor block
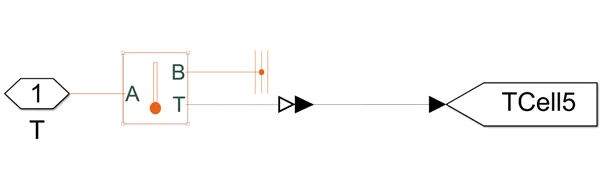
This block tracks the Cell temperature of different cells
Cell Block
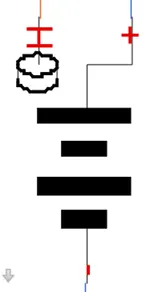
Below is the inside view of the Cell block
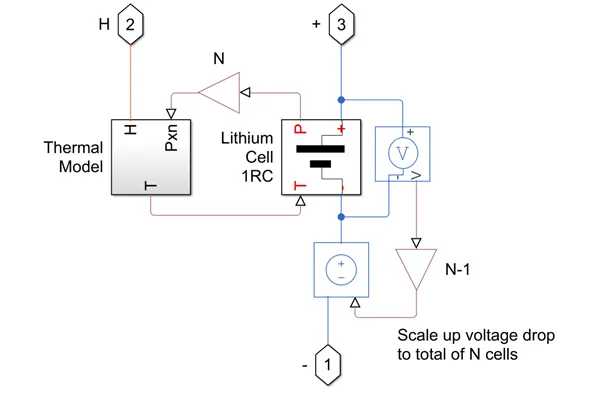
Below is the inside view of the ‘Lithium Cell 1RC’ Block
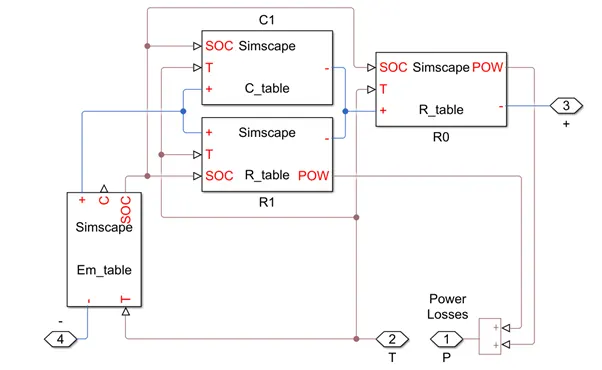
Here there is an RC circuit inside the cell block which determines values from the Table allotted to it
There is a resistor block which calculates the Value depending on the signal of SOC and Temp. Similarly the Capacitor block also calculates the value depending on SOC and Temp.
Thermal model
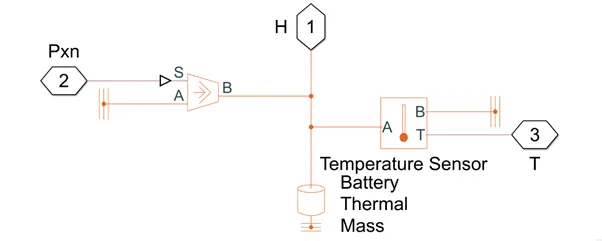
This Temperature block senses the Temperature of the battery and send signal to the Battery block which then calculates the power losses.
Workspace
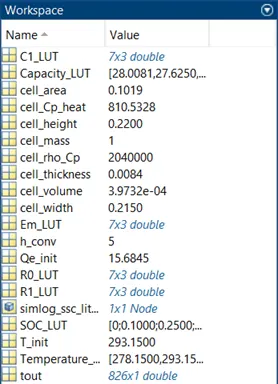
These are the Values of the Variable present in different Tables above
Result:-
Case 1 :- When the input to the cell is a cyclic charge and discharge profile
Temperature
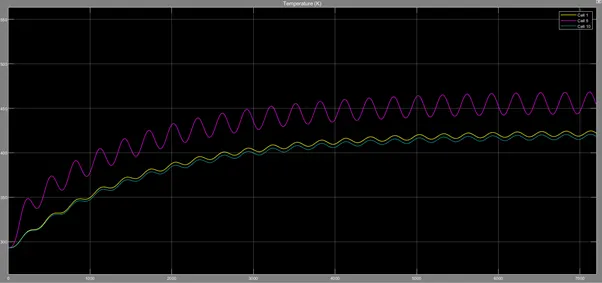
We can see that the temperature of the Faulty cell is more as compared to those of the regular one.
The Temperature of the Faulty cell rises to almost 450K, whereas the Temperature of the regular one goes upto almost 420K. Because of conduction between the Faulty cell and the regular one, the better cells also gets affected.
SOC
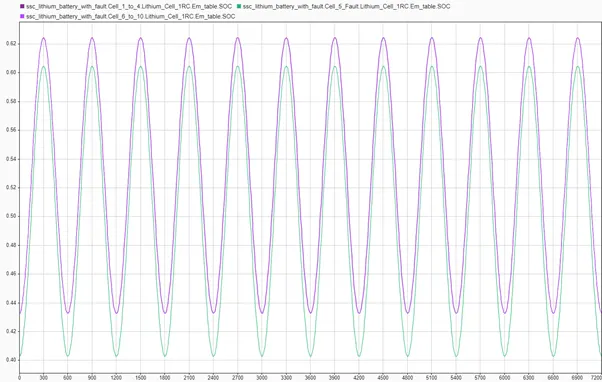
The above graph is the SOC of Faulty and the Regular Cells. The green colour curve is the SOC of the Faulty cell, whereas the purple curve shows the SOC of the regular one. Here as we can see from the above temperature graph, that the temperature of the Cell affects the batteries capacity and life cycle also. Since the Faulty Cell has the highest temperature, its capacity decreases as seen from the green curve.
Case 2 :- When the input to the cell is in the form of Drive cycle (UDDS)
Temperature
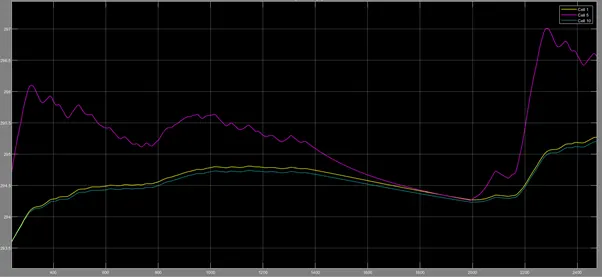
Here we can see that the Temperature rise of the Faulty Cell is much greater than the regular one.
The highest temperature reached by the Faulty Cell is almost 297K, whereas the regular cell attains a highest Temperature of almost 295.3K.
SOC
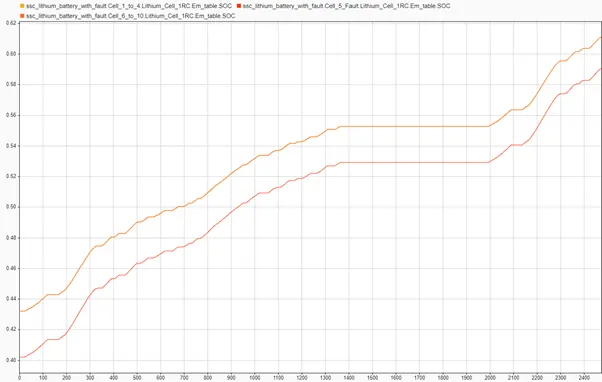
The above graph is the SOC of the Cells, i.e the one with the Fault and a healthy one. The Red line shows the SOC of the Faulty cell whereas the yellow and orange line shows the SOC of regular cells
Here we can see that the cells capacity is affected by the Faulty cell, i.e when in charging mode, the Regular Cells will get charged to its full capacity while the faulty one will be somewhat below its full capacity. And when Discharging takes place, the Faulty Cell will get fully discharge leaving some unused energy in the Regular one.