Project 2 Thermal modeling of battery pack
QUESTION:
For a 10 cell series lithium ion battery model, simulate the thermal effects and compare life cycle performance at various temperatures, charge & discharge rates using MATLAB.
We have an in-built MATLAB model "Lithium ion battery pack with fault". Let us look at the model.
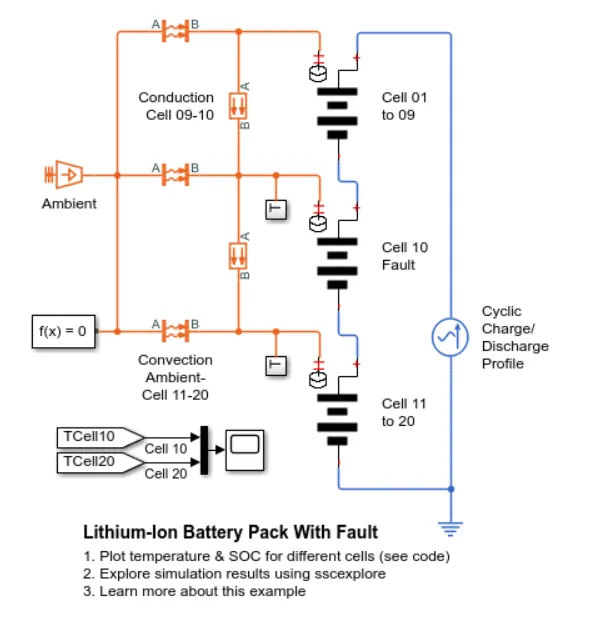
This model contains 20 lithium-ion battery cells connected in series. The 10th cell in this battery pack is considered as a faulty cell. Here, faulty cell means that the temperature of this particular cell in this battery pack is not maintained properly.
This example shows how to simulate a battery pack consisting of multiple series-connected cells in an efficient manner. It also shows how a fault can be introduced into one of the cells to see the impact on battery performance and cell temperatures. For efficiency, identical series-connected cells are not just simply modeled by connecting cell models in series. Instead a single cell is used, and the terminal voltage scaled up by the number of cells. The fault is represented by changing the parameters for the Cell 10 Fault subsystem, reducing both capacity and open-circuit voltage, and increasing the resistance values.
The parameters of the faulty cell is shown below.
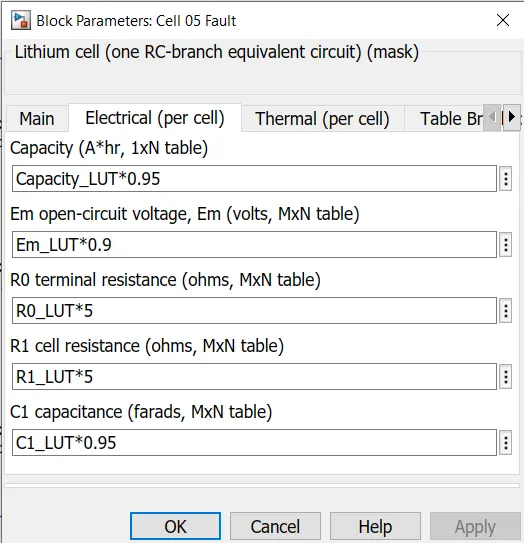
We can see that the capacity is reduced by 5% and the open circuit voltage is reduced by 10% to show the fault in that particular cell. The resistance in the cell is also increased so that the temperature of the cell goes beyond the limit.
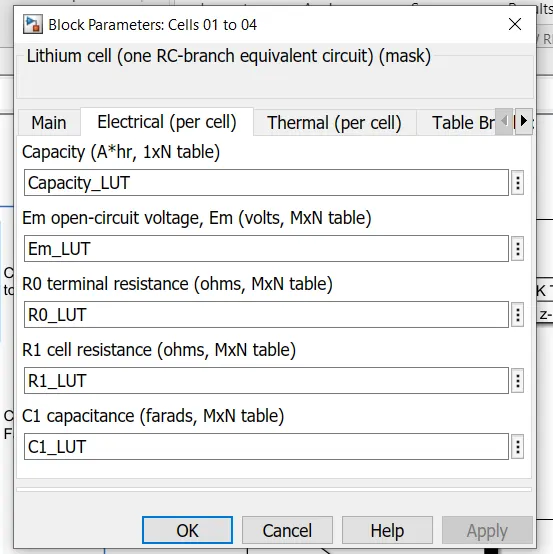
The capacity in the other cells are used up to their full potential.
The battery cells in the pack are assumed to be air-cooled. Hence, heat transfer is considered in the battery pack. Convective heat transfer from the battery cells to the surrounding environment is considered & conductive heat transfer between battery cells is considered.
Now we will make certain changes to this model.
We are asked to model only a 10 series lithium-ion battery pack.
So we change the number of cells in the battery blocks present in the model. The first battery block is changed from 9 cells to 4 cells. Cell no 5 is kept as the faulty cell. Then the third battery block is changed from 10 cells to 5 cells.
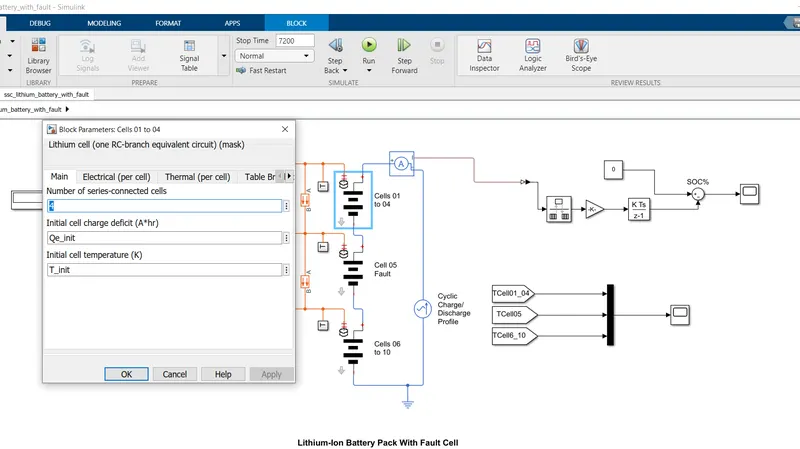
Similarly the other two blocks are also changed.
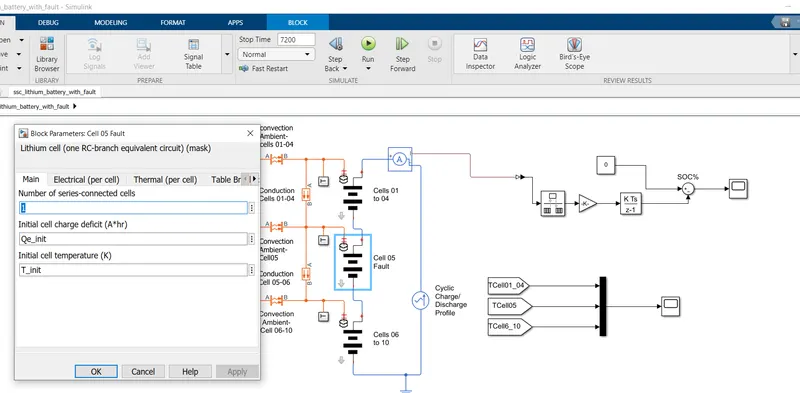
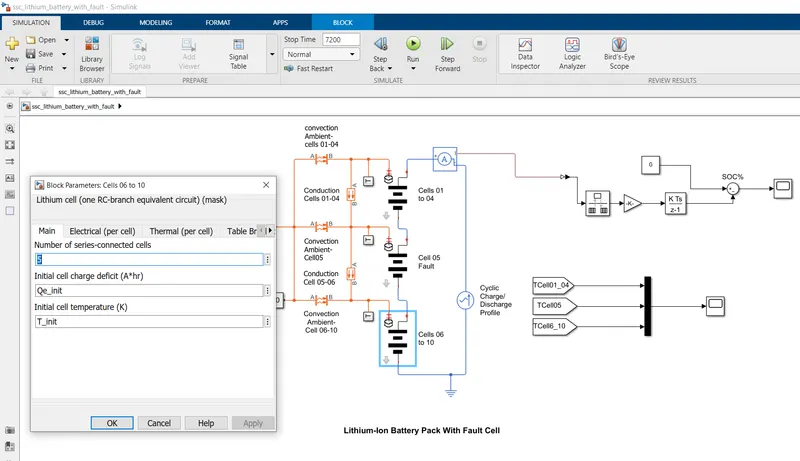
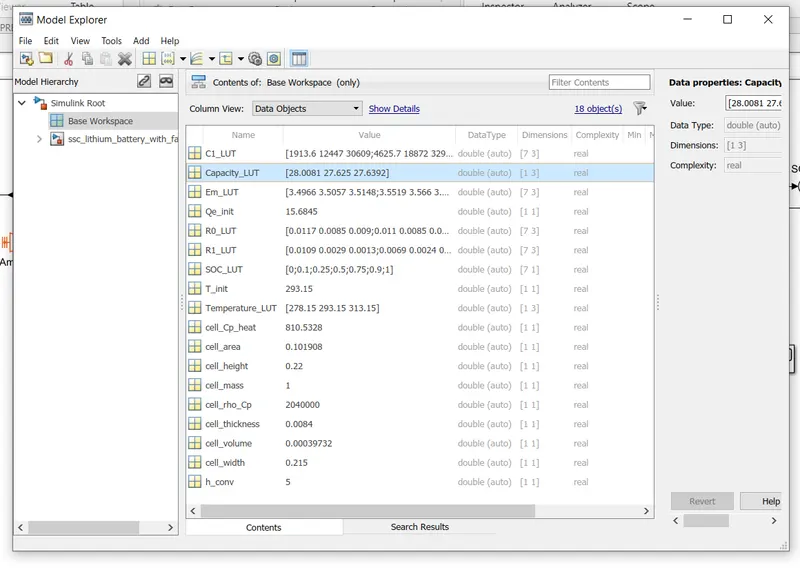
The cell parameters (Capacity, resistance, temperature,open circuit voltage etc.,) are seen in the battery block as a look up table. The parameters are shown below.
Now we must create a SOC system to calculate the SOC of the battery pack. The blocks used are shown below.
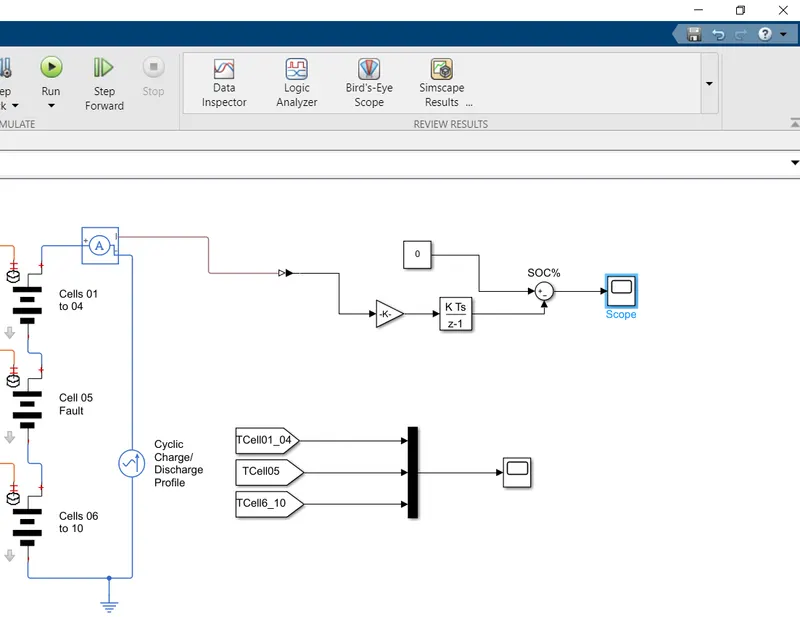
A current sensor block is first used to measure the current flowing through the battery pack. Then we use a PS-simulink converter to convert the simscape signals to simulink format.
Then a gain block is used. The gain block is used here because we use the couloumb counting method to calculate the SOC of the battery pack. The gain value is set at 1/10000.
Then a discrete-time integrator block is used to integrate the current flowing through the circuit. A constant block with a value of 0(Initial SOC) is kept. Then they are subtracted and sent to a scope window.
Now that the SOC system is ready, we must create a subsystem in which all the cell temperatures are measured throughout the simulation time.
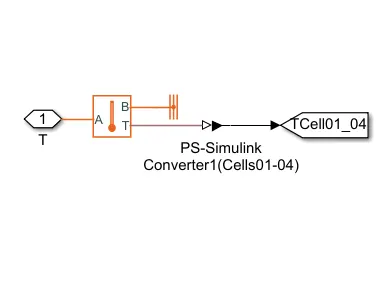
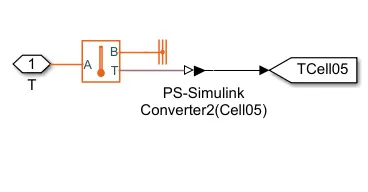
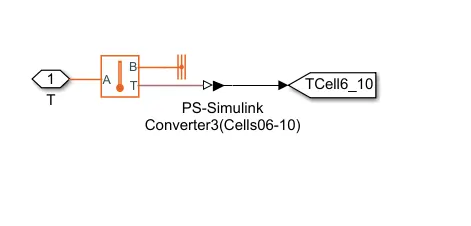
They are connected to the thermal network of the circuit. The Goto tags and From tags are used to measure the temperature of the cells within the battery pack. The From tag is created outside the network to measure the temperatures through the scope window.
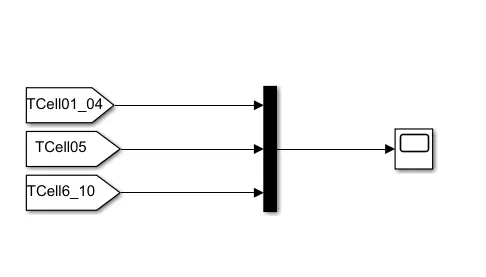
The convective heat transfer parameters are shown below.
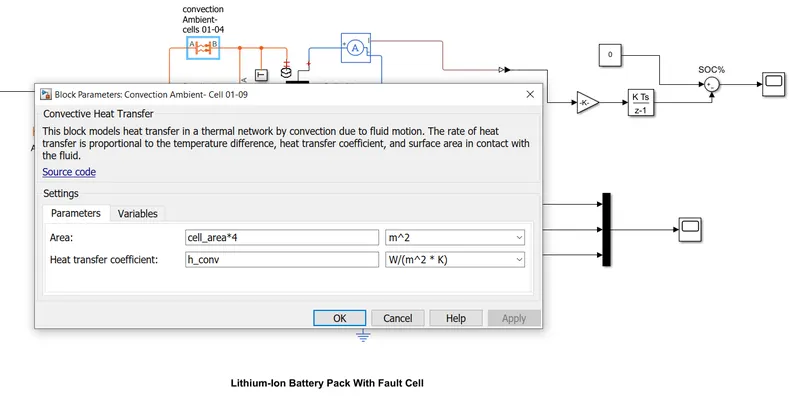
This is for cells from 1-4. The heat transfer co-efficient is seen in the lookup table.
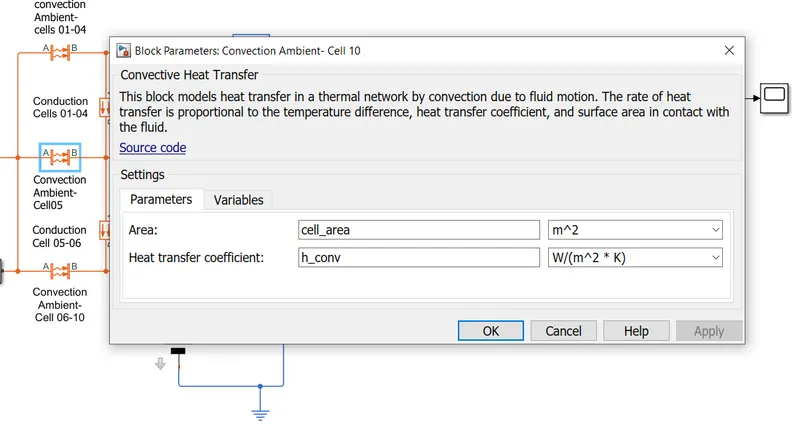
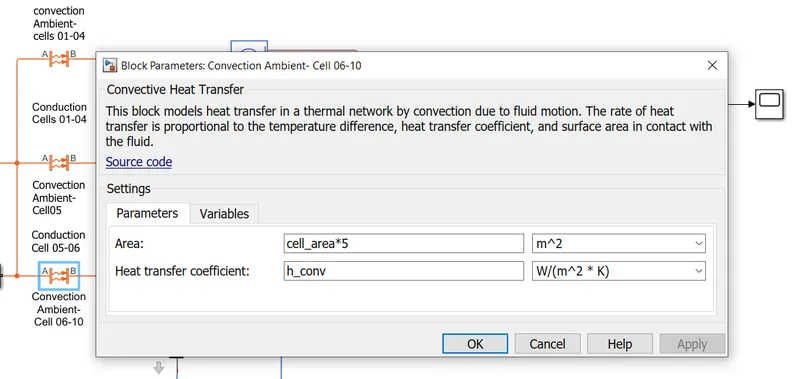
Similarly for cell 5 & cells 6-10 are shown below.
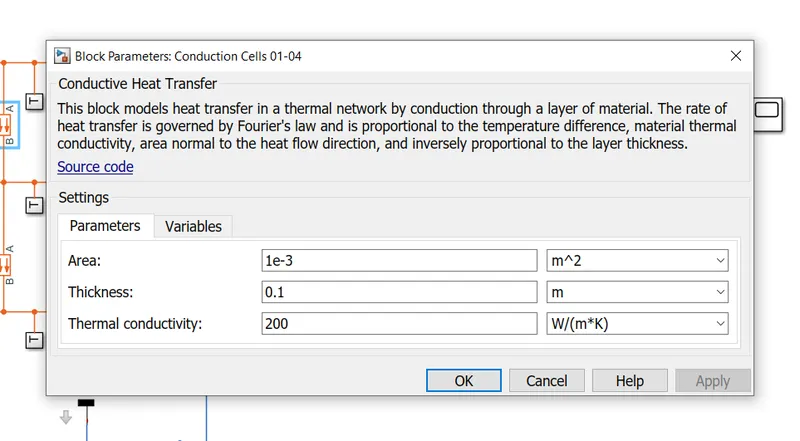
The conductive heat transfer parameters are shown below.
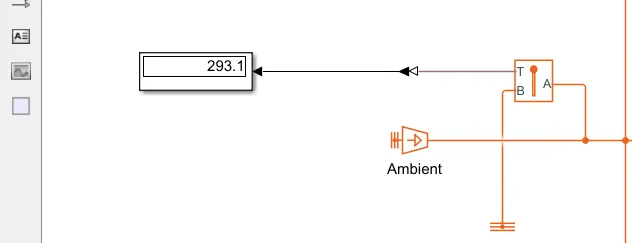
A display block is kept to see the ambient temperature of the cells in the battery pack.
Now we will run this model for a stop time of 7200 seconds. The temperatures and SOC of the battery pack is seen below.
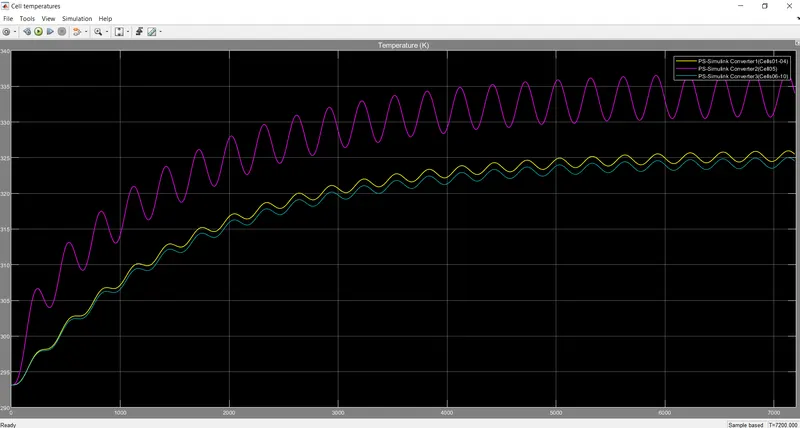
We can see from the plot that the faulty cell 05 has the highest temperature in the pack. This is because the cell temperature is not monitored properly. The other cells temperature is moderate from 295k to 325K.
Even if one cell's temperature is not monitored properly, it will lead to bad performance of the overall battery pack. The battery's maximum capacity will not be achieved because the TMS of the battery will decrease the charge/discharge rates down to protect the faulty cell from damage.
The SOC plot of the battery pack is seen below.
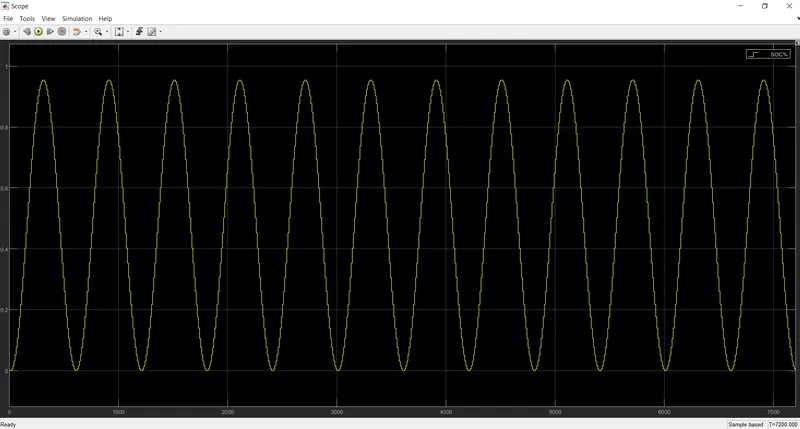
The SOC is fluctuating throughout the entire simulation time. The SOC goes to 0.9 from 0 at 300 secs & falls down to zero again at 600 secs. This keeps repeating for the entire simulation.
From this plot we can see that the life of this battery is 6 cycles per hour.
The life cycle of the battery can be even more improved if the faulty cell in the battery pack is removed.