Project 2 Thermal modeling of battery pack
For a 10 cell series lithium ion battery model, simulate the thermal effects and compare life cycle performance at various temperatures, charge & discharge rates using MATLAB.
The model in which the simulation is performed is from the matlab base model. Changes are done accordingly to obtain the responses of various parameters.
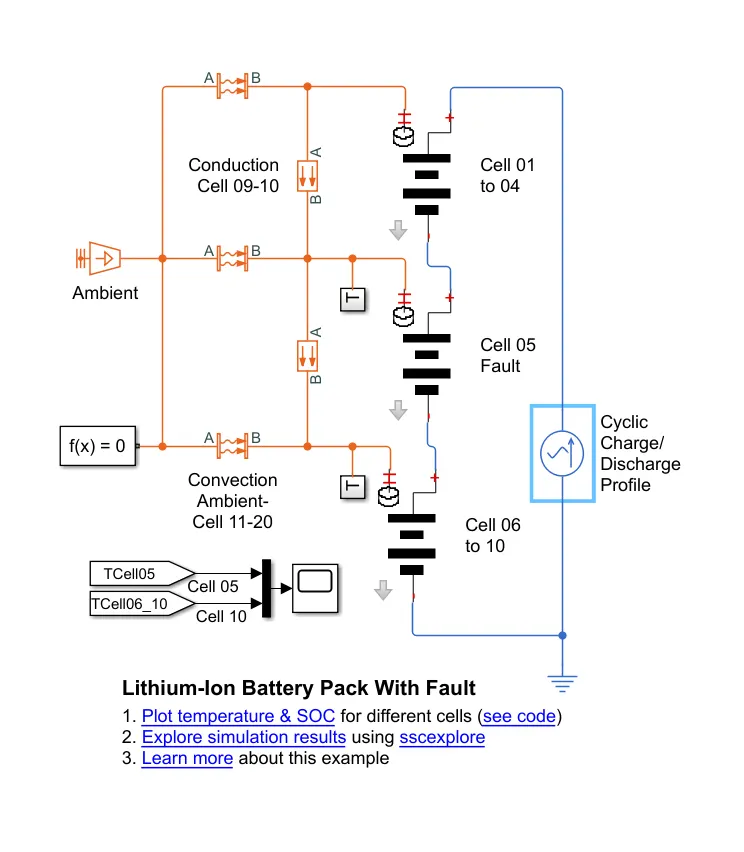
The model provides us with clear understanding of simulation of battery pack consisting of multiple series connected cells. The faults are introduces into one of the cells to see the impact on battery performance and cell temperatures.
For efficiency, identical series-connected cells are not just simply modeled by connecting cell models in series. Instead a single cell is used, and the terminal voltage scaled up by the number of cells.
The fault is represented by changing the parameters for the Cell 10 Fault subsystem, reducing both capacity and open-circuit voltage, and increasing the resistance values.
The simulink model for the above objective is
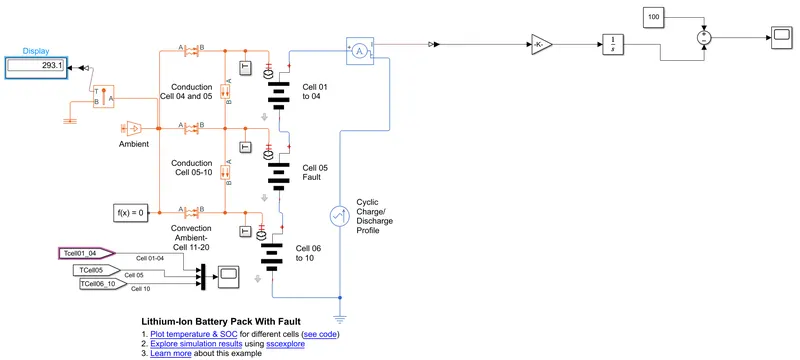
The blocks used in the model is
1. Temperature sensor
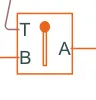
This measures the temperature in the thermal network. There is no heat flow through the sensor.
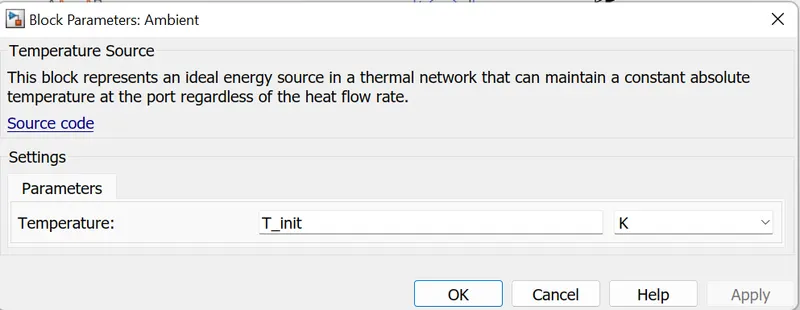
2.Temperature source
The parameters in the temperature source block is
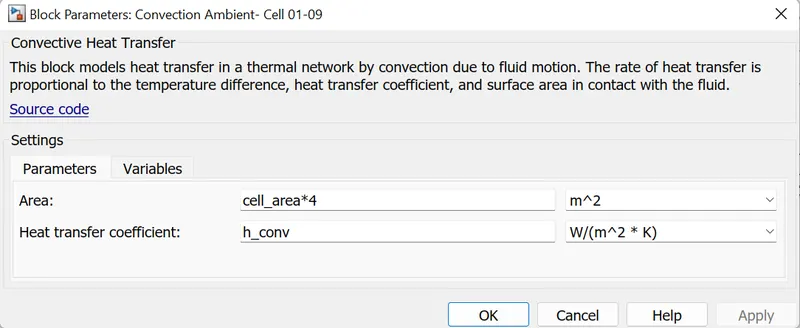
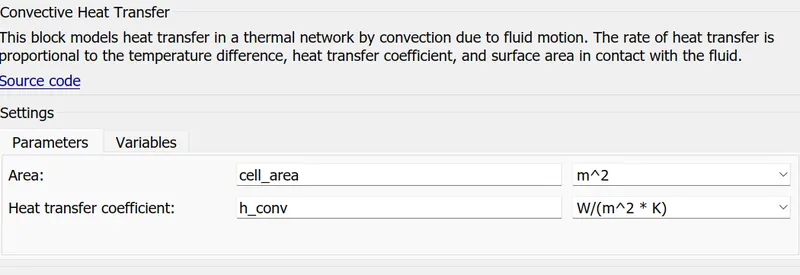
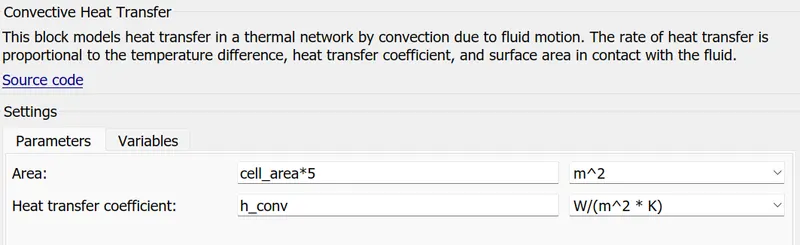
3.Convective heat transfer
The rate of heat transfer is proportional to the temperature difference, heat transfer coefficient and surface area in contact with fluid.
4. Conductive heat transfer
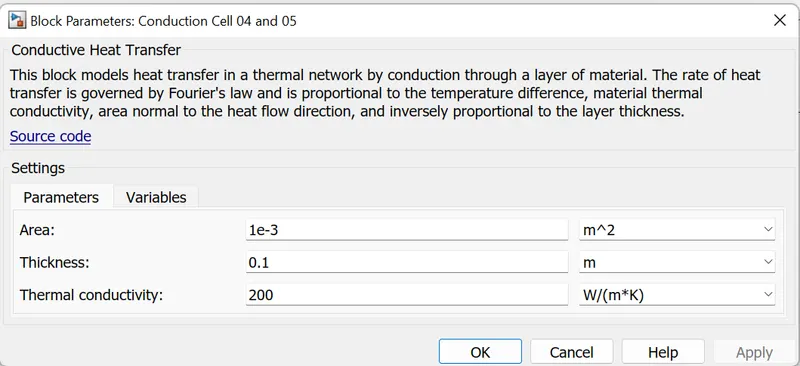
This value is same for other conductive heat transfer blocks.
5. Battery pack
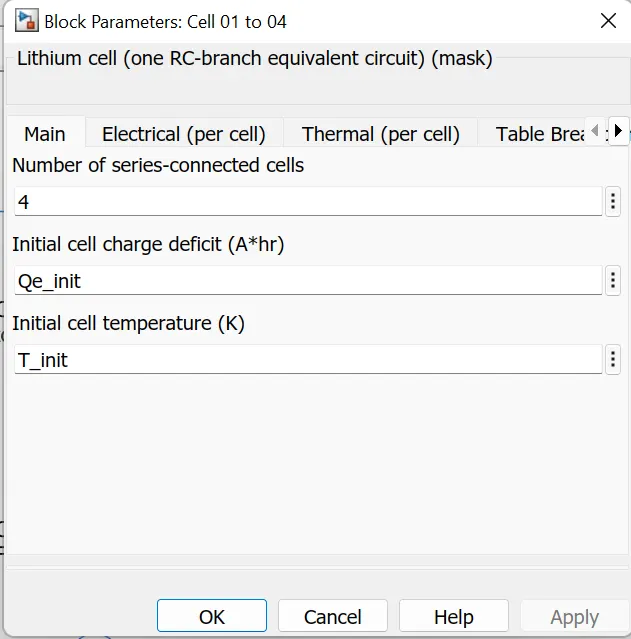
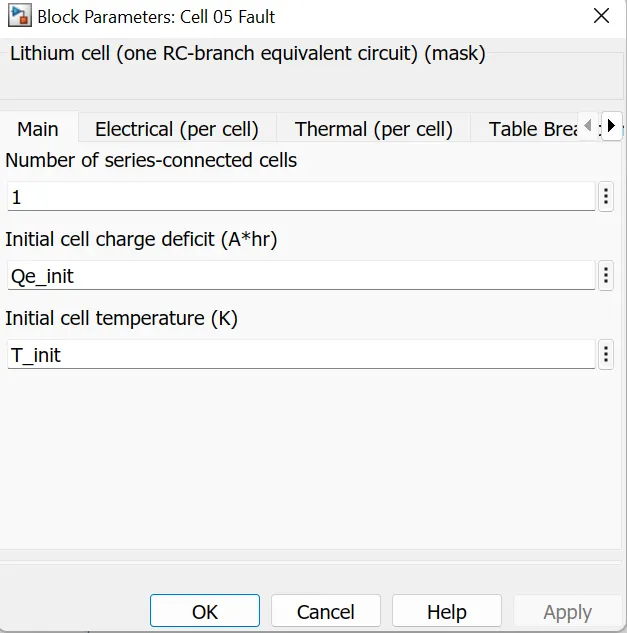
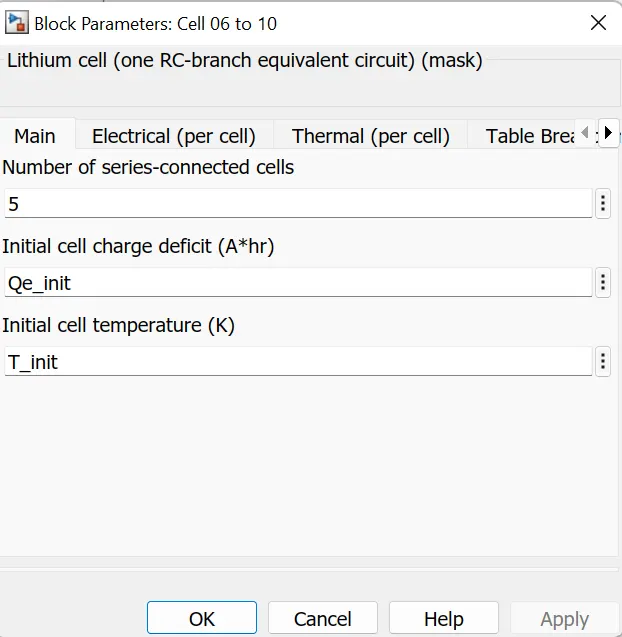
The battery subsystem
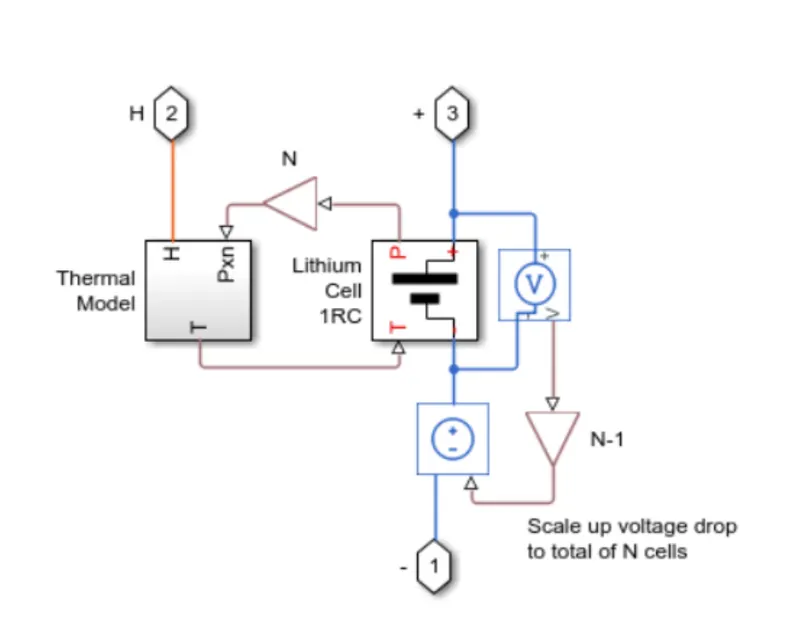
This consists of thermal model and lithium cell 1RC block which calculates the temperature and thermal effect for cells and overall calculation for the battery pack.
The ps gain block multiplies the input physical signals by a constant. Other blocks include voltage sensor and current-voltage source.
Lithium cell 1RC
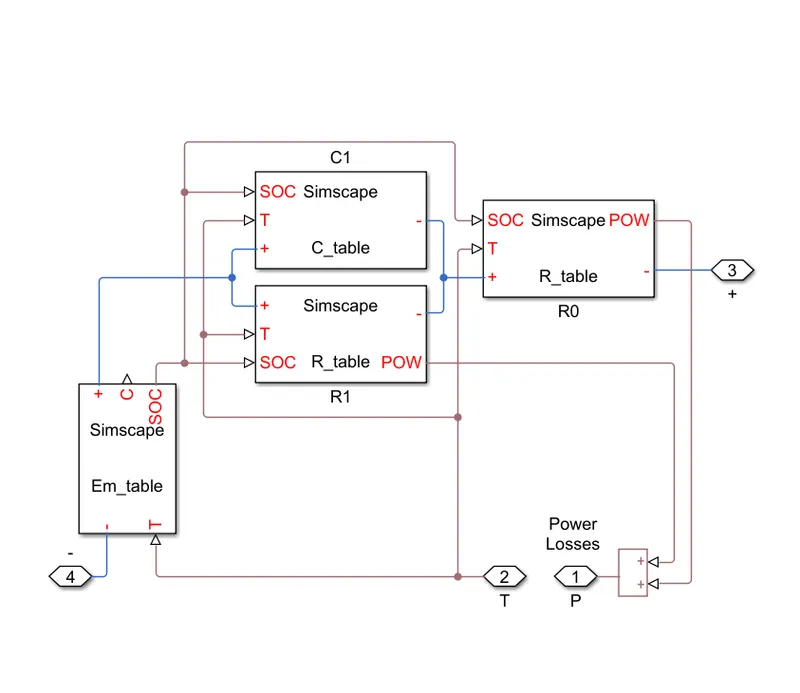
It consists of the capacitor value table which depends upon an external physical signal input, SOC and T. Capacitor value varies with time and hence the equation i=C*DV/dt holds.
Resistance value table depends on extermal physical signal inputs SOC and T.
Voltage value(Em) implements the cell's main branch voltage source and determines values for capacity and SOC.
5. Gain block
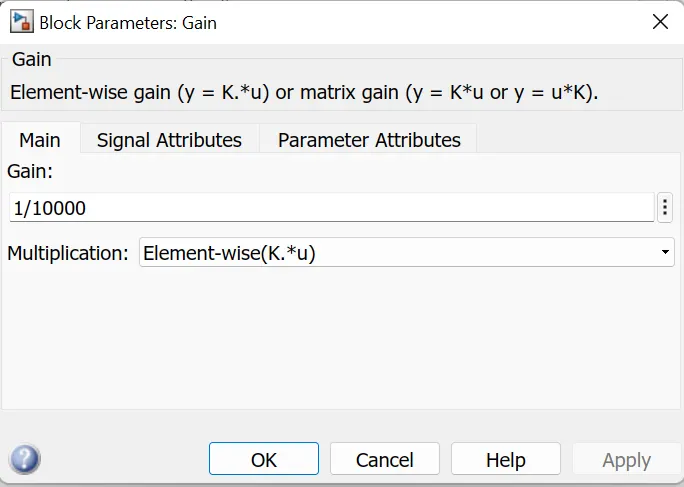
It is used for the estimation of SOC.
6. Integrator block
7. current sensor
8. AC current source
It is an ideal current source and maintains the sinusoidal current through it. In this model it is used for the estimation of cyclic charge/discharge.
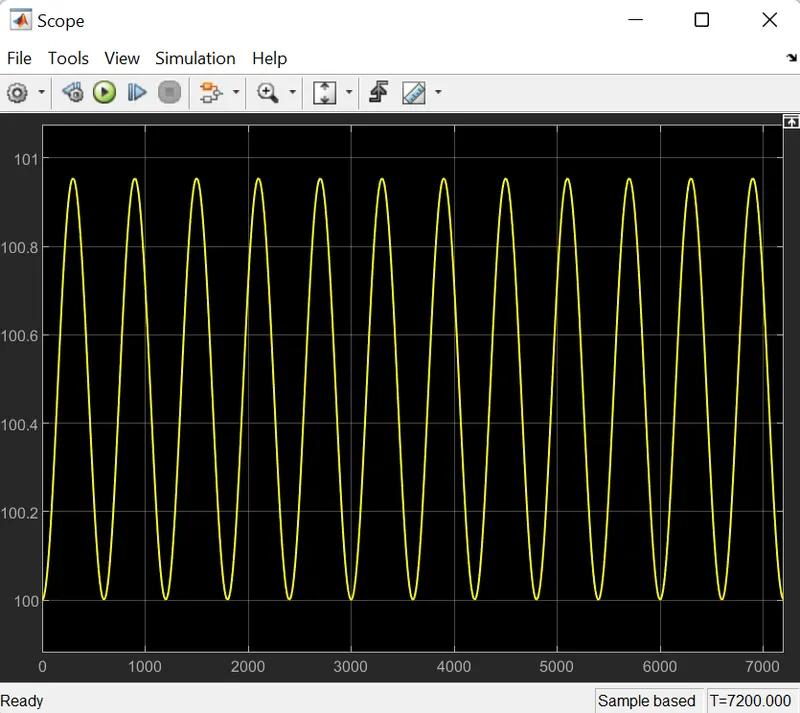
The output obtained is
SOC
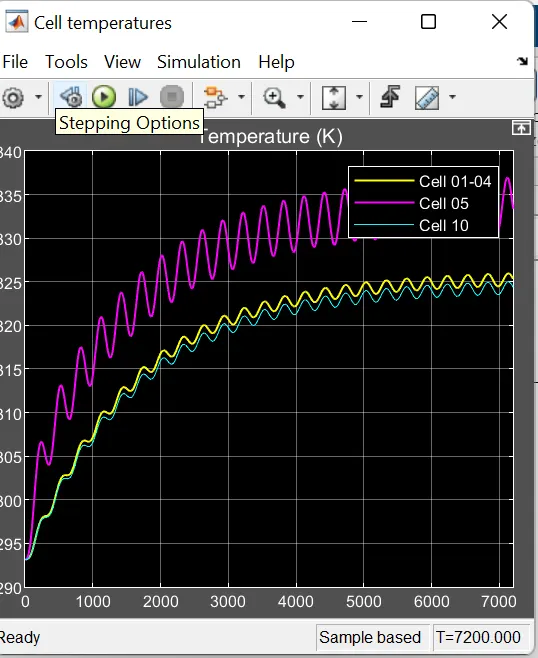
The ambient temperature provided by the source is 293.15 k
The battery pack cell 01-04 reaches a maximum temperature of 336k. The faulty cell 05 reaches maximum temperature of 325k. The cell pack 06-10 reaches maximum temperature of 324k
The model which have input from UDDS datasheet
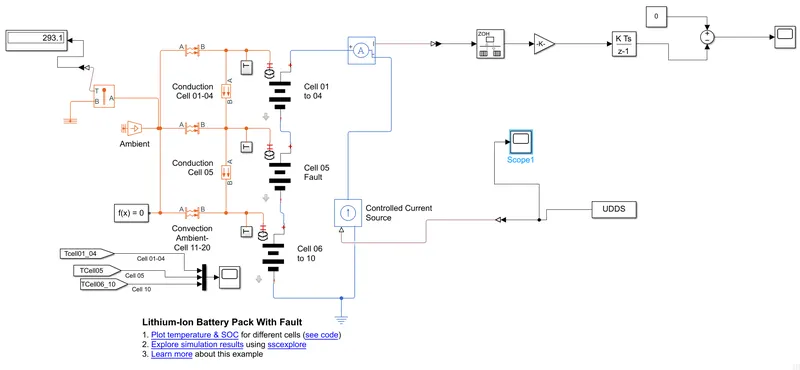
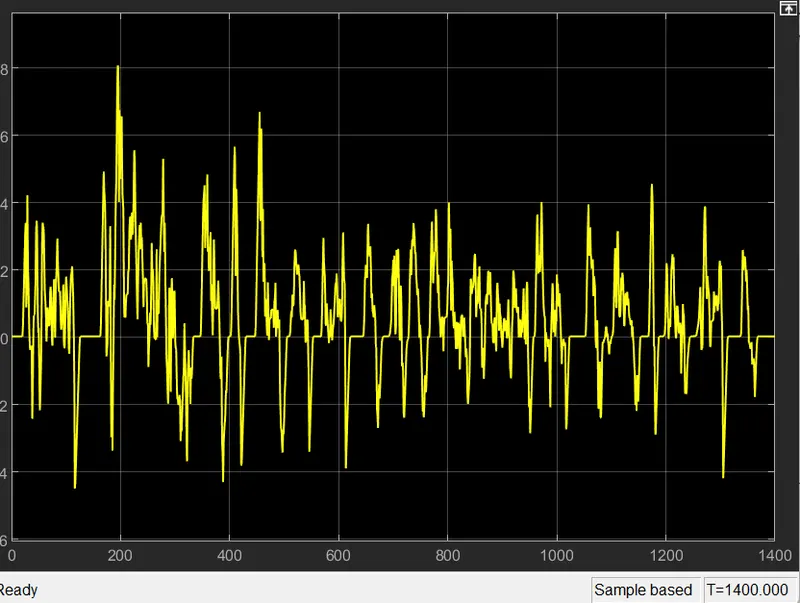
Here the UDDS drive cycle data is obtained by importing the excel sheet to the matlab workspace.
Controlled current source is used for this simulation. It maintains specified current through it regardless of voltage across it.
The UDDS drive cycle input
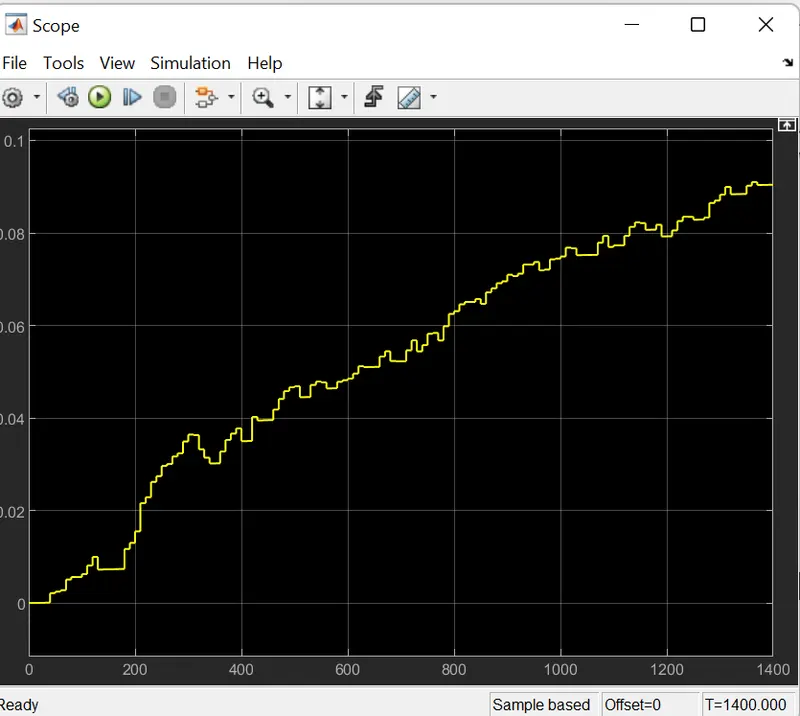
SOC obtained
CONCLUSION
Ambient temperature provided by the temperature source is 293.15k
The SOC of the model starts from 0 and reaches 0.9 in 1400 sec
https://drive.google.com/file/d/1eVIOrbjC37gI1gFTtuvQFot1oWJCUa2m/view?usp=drivesdk
https://drive.google.com/file/d/1eWDC4QG8P6y9PbtHY3WA4l8cP0_dg68w/view?usp=drivesdk