Project 2 Thermal modeling of battery pack
For a 10 cell series lithium ion battery model, simulate the thermal effects and compare life cycle performance at various temperatures, charge & discharge rates using MATLAB.
ANSWER:-
OBJECTIVE:-
- For a 10 cell series lithiumion battery model,simulate the thermal effects and compare life cycle performance at various temperatures, charge & discharge rates using MATLAB.
THEORY:-
- Now a days lithium ion battery are mostly usedin electric vehicles we must knowits charge and discharge rates to operate this batterys in efficient manner and without damage when this batterys in operation this temperature of it must be keptin limit we simulate the thermal effect of this cell, by knowing the how much temp rise take place we can provide efficient cooling to the batterys so that the life cycle of the battery increases we will see a model on this issue below and explaination as follows
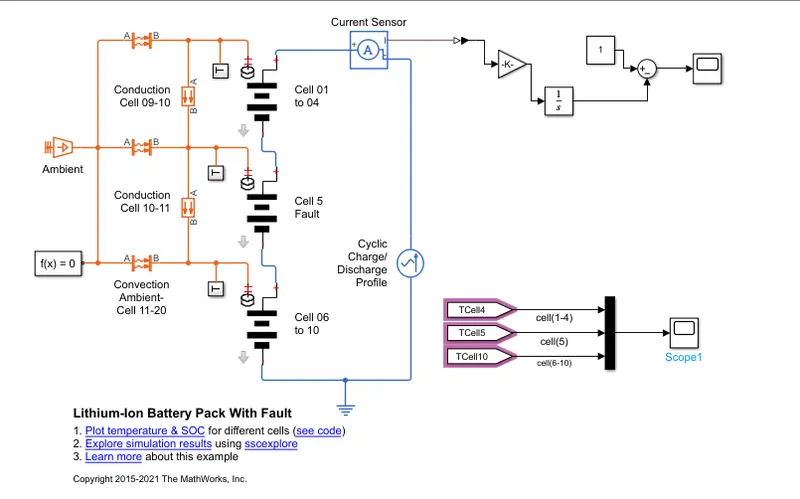
- cells connected in series and one of the cell is faulty so what will be thermal effect,
- This example shows how to simulate a battery pack consisting of multiple series-connected cells in anefficient manner. It also shows how a fault can be introduced into one of the cells to see the impact on battery performance and cell temperatures
- For efficiency,identical series-connected cells are not just simply modeled by connecting cell models in series. Instead a single cell is used,and the terminalvoltage scaled up by the number of cells. The fault is represented by changing the parameters for the Cell10 Fault subsystem, reducingboth capacity and open-circuit voltage, and increasing the resistance values.
Building of model and working:-
Battery 1 to 4 subsystem:-
in this ckt we use i-ion cell lto 10 ,temperature sensors,ambient temp block ,state of charge estimation scope,charge discharge profile given to ckt ,from & goto block block matlab simulink
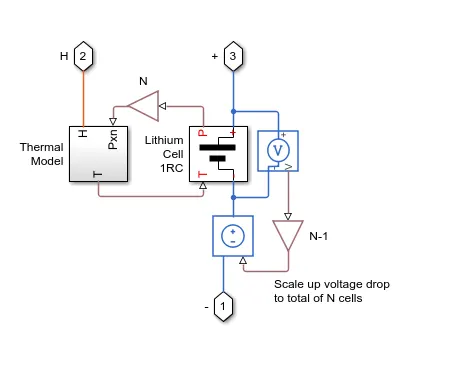
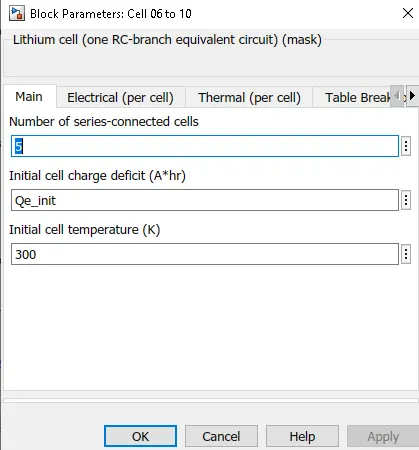
- Cell subsystem consists of a thermal model and lithium cell 1RC block which calculates the temperature and thermal effect for cells and overall calculate for the battery pack.
- The same subsystem used for 6-10 cells and for faulty cell 5.
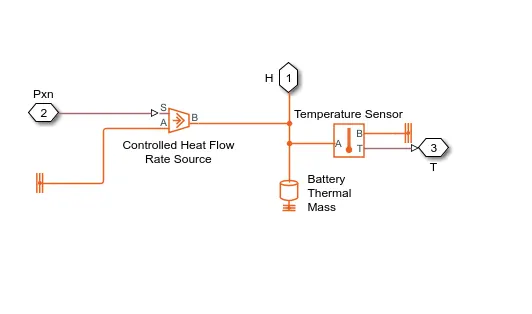
Thermal model Subsystem:-
Lithium Cell 1RC subsystem:-
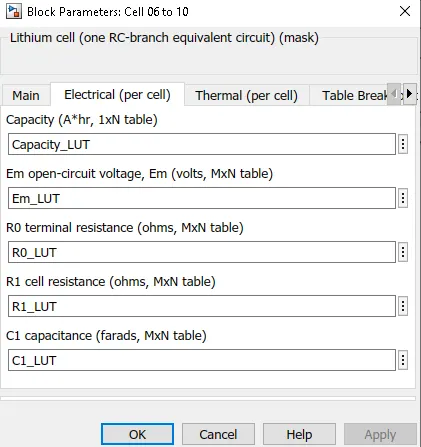
- This block basically consists of capacitance value table which depends on an external physical signalinputs soc and T. It is assumed that the capacitance valueis slowly varying with time,and hence the equation i = C*dv/dt holds.
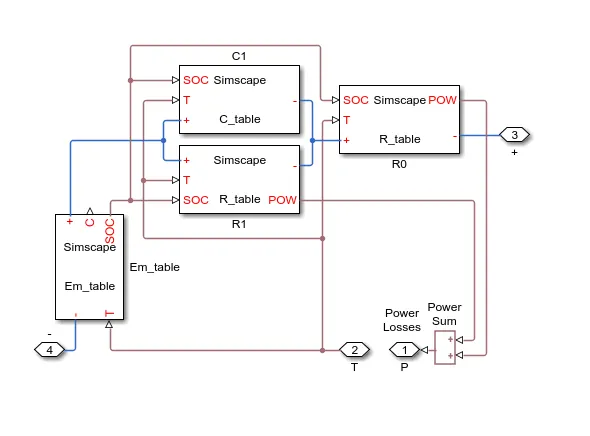
- Resistance value (R) table which depends on an external physical signalinputs SOC and T.
- Voltage value (EM) whichimplements the cell's main branchvoltage source, and determines values for capacity (c) and state of charge (soc).The
defining equations depend on cell temperature T,
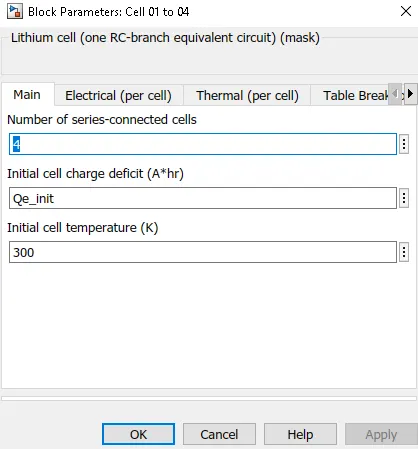
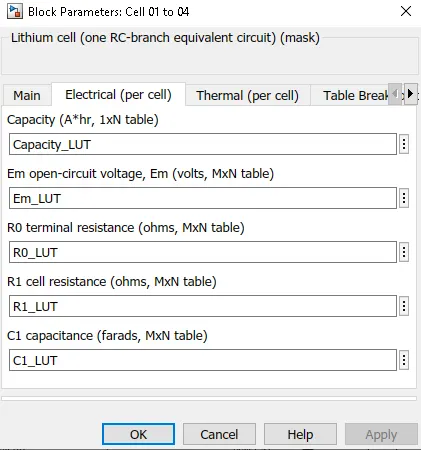
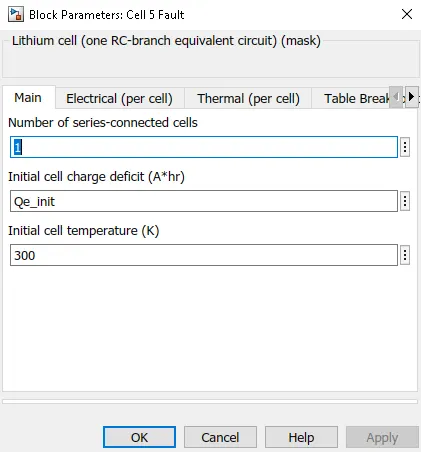
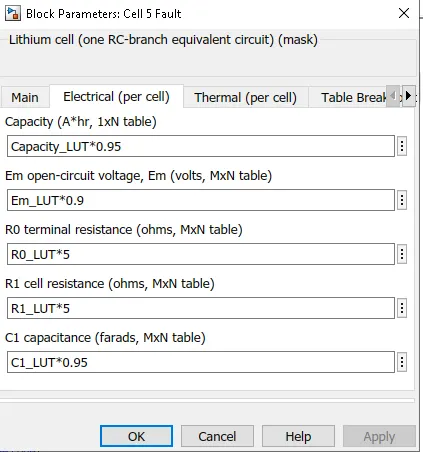
- output of one cell is connected with the SOC estimation whereas other output is connected with AC current source for cyclc charge/discharge profile.
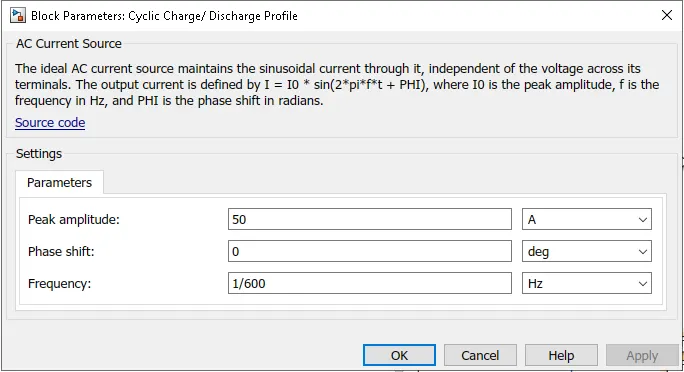
- The peak amplitudes set to 50 A for cyclic charge and discharge.A basic parameter of AC current source is as
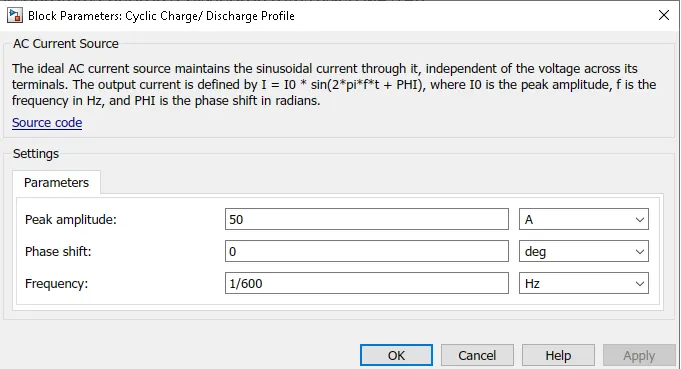
other block which are used in lithium ion battery pack are as:
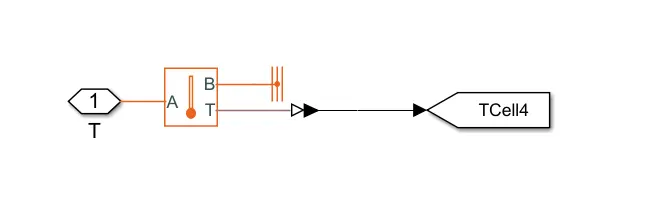
Temperature sensor:-
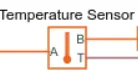
- The Temperature Sensor block represents anideal temperature sensor,thatis, a device that determines the temperature differential measured between two points without drawing any heat.
- Connections A and B are thermal conserving ports that connect to the two points where temperature is being monitored. Port T is a physical signal port that outputs the temperature differential value.
- The block positive direction is from port A to port B.The measured temperatureis determined as T = TA - TB
- This block represents an idealenergy source ina thermal network that can maintain a constant absolute temperature at the port regardless of the heat flow rate.
- This block is used for ambient temperature which we can set and check results.
Convective Heat Transfer:-

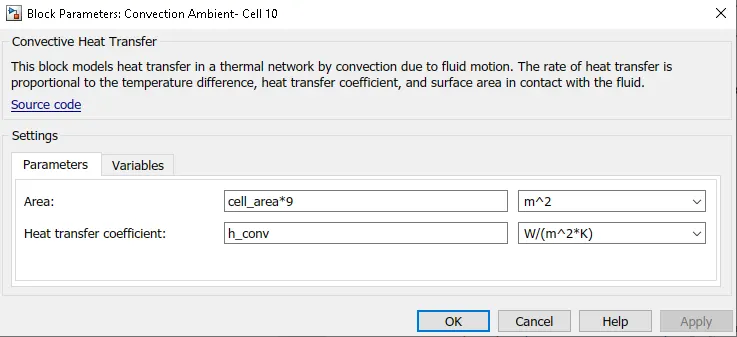
- This block models heat transfer in a thermalnetwork by convection due to fluid motion. The rate of heat transfer is proportional to the temperature difference,heat transfer coefficient, andsurface area in contact with the fluid.
this used for 1-4 cells and 6-10 cell
State of charge estimation:-
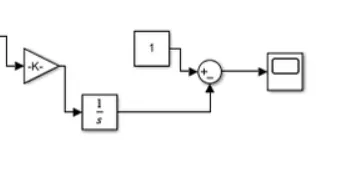
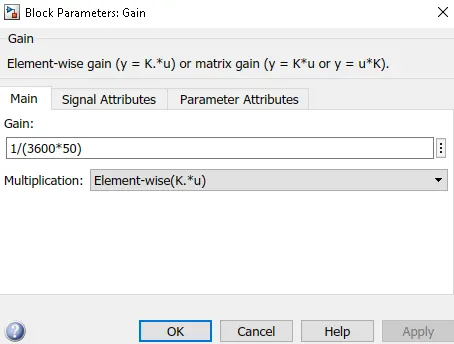
- The Coulomb counting method measures the discharging current of a battery andintegrates the discharging current over timein order to estimate soc
- This subsystem takes current as input and gives the battery SOC % as output. A current sensor blockis used and connected for soc estimation
- This ckt estimates the battery SOC % using coulomb counting method. It takes current as the input and gives SOC% as output.Initial soc of the battery is assumed to be 100% (1)
- example shows how to simulate a battery pack consisting of multiple series-connected cells in an efficient manner.It also shows how a fault can be introducedinto one of the cells to see the impact on battery performance and cell temperatures
AC current souce:-
RESULTS:-
For a 10 cellseries lithiumion battery model we simulate the thermal effects and compare life cycle performance at various temperatures, charge & discharge rates using MATLAB. results are as follows
1.scope results at 300k (26.85 degree celcius)
- 1-4 cells are normal cell 5th cell is faulty 6-10 cellis normal cell as we are simulating thermal effect on we give Cyclic Charge/ Discharge Profie to circuit the waveform you can see above results allconditions it is same but when ckt is run on this drive cycle profile as 5th cell was faulty it will show temperature rise high than any other cell and the life cycle of cell get reduced and cell even can get damaged
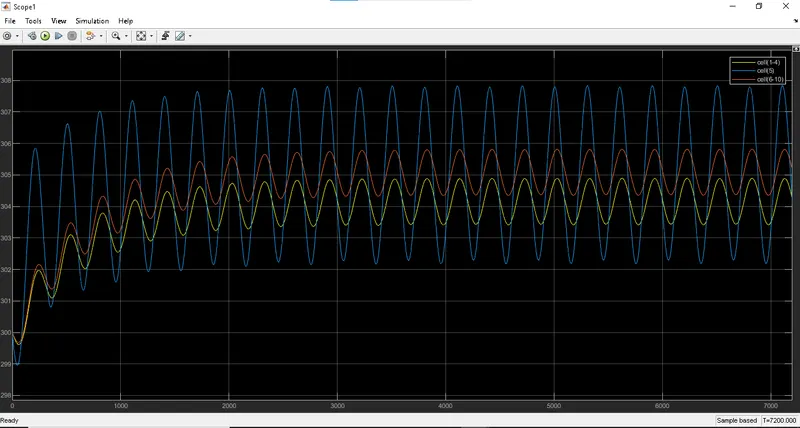
- so as we give temp of results at 300 k ie 26.85°C the 1-4 and 6-10 cell temperature is near to 306k i.e (32.85 °C).
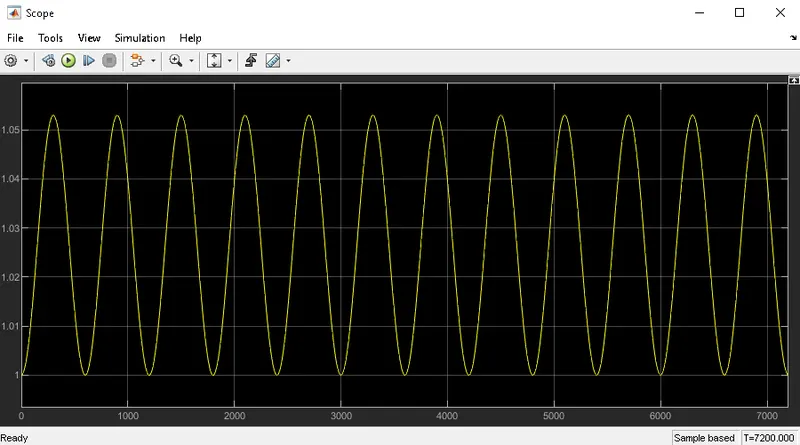
- but 5th faulty cell temp goes to 308k i.e (34.85°C) and the drive cycleis shown which is cyclic Charge/ Discharge drive cycle.
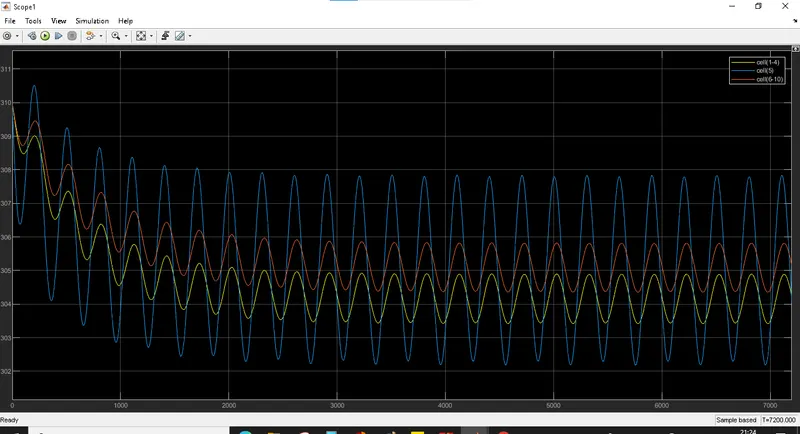
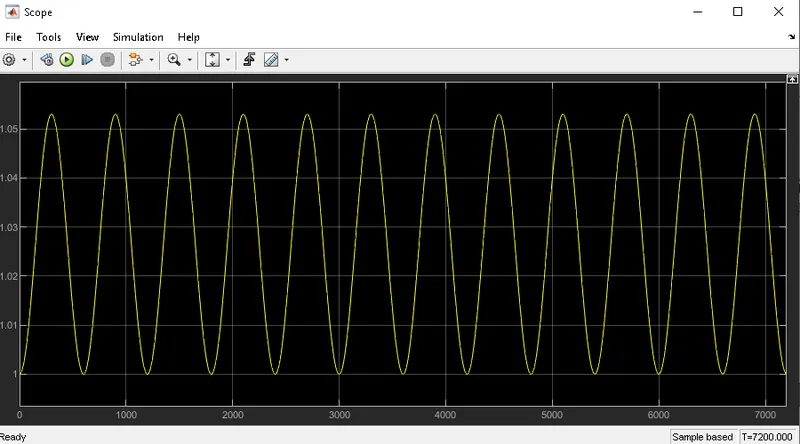
2. scope results at 310k (36.85 degree celcius)
- In second condition we give temp 310 k ie 36.85°C and 1-4 and 6-10 cell temp is near to 307 k (33.85°C) but 5th faulty cell temp goes to 310k ie 36.85°C and the drive cycle is shown which is Cyclic Charge/ Discharge drive cycle.
3. scope results at 315k (41.85 degree celcius)
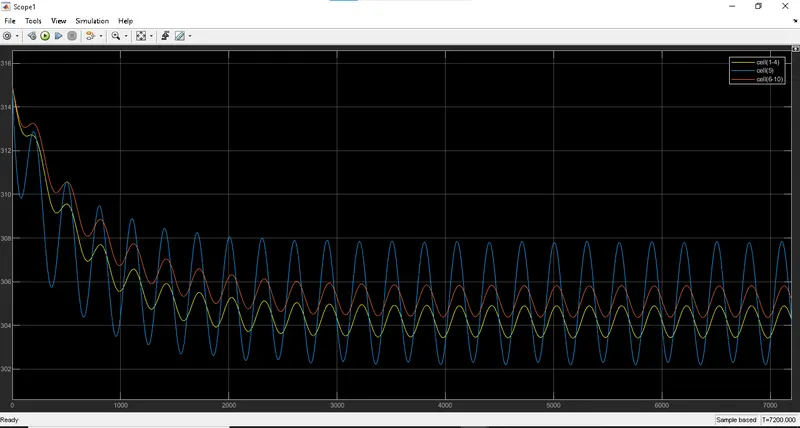
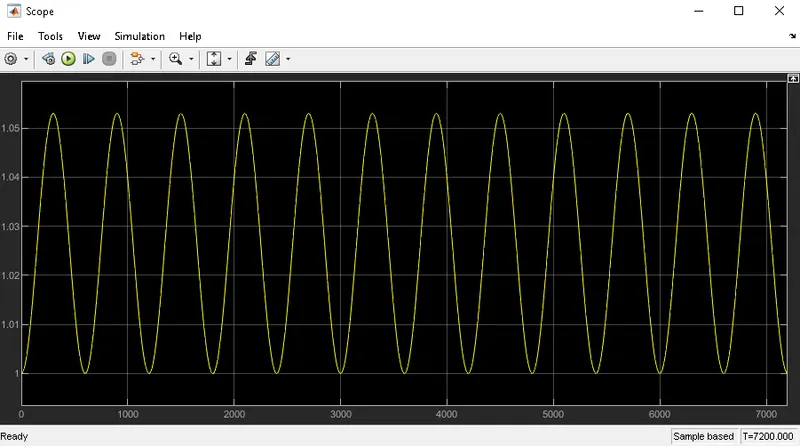
- In third condition we give temp 315 k ie 41.85°C and 1-4 and 6-10 cell temp is near to 306 k i.e(32.85°C) but 5th faulty cell temp goes to 308k ie 34.85°C and the drive cycle is shown which is Cyclic Charge/ Discharge drive cycle.
conclusion:-
we simulated the thermaleffect and compared at various temperature ,faulty cell temp rise more than normal cellcharge and discharge cycle given and due to temp rise it can damage the cell and reduce the performance of the battery.