Project 2 - Supply and Demand Gap Analysis
Project 2 - Supply and Demand Gap Analysis
Aim
The objective of this project is to conduct a thorough analysis of data related to Sigma Cabs, a cab company, in order to identify both strengths and weaknesses and provide recommendations for improvement. Through the collection and analysis of relevant data, this project aims to provide insights and understanding of Sigma Cabs' operations and performance in order to support decision-making and drive positive change.
Introduction
The purpose of this study is to examine the preferences and behaviors of customers who use Sigma Cabs, a cab company. By analyzing data on cab and customer details, we aim to understand which types of cabs are most popular among customers and how this information can be used to increase profitability in the future. This analysis will provide valuable insights into the needs and preferences of Sigma Cabs' customers and can inform strategic decision-making and planning within the company
Problem statement
This project aims to investigate several aspects of Sigma Cabs' operations and customer behavior through data analysis. Specifically, the following research questions will be addressed:
How does the average customer rating and average trip distance vary according to different measures and DAX functions?
What is the relationship between the sum of cancellations last month and the sum of customers across months?
How do cancellation records differ according to gender?
How does the trip distance vary according to different types of cabs?
How does the customer rating vary according to different types of cabs?
How does the lifestyle index vary according to the confidence lifestyle index?
How do the sum of all three variables vary according to different types of cabs?
How does the total trip distance vary according to gender?
How does the number of customers across months and surge pricing type vary according to destination type?
How do the cancellation last month and sum of customers across months vary according to cab type?
How does the number of customers across months vary according to gender?
How do the sum of all three variables vary according to gender?
Methodology
The following methodology was followed to collect and analyze data for Sigma Cabs:
-
Data Importing: The CSV data file named "sigma_cabs" was imported into Power BI Desktop using the "Get Data" option and the "Load" button.
-
Data Cleaning: After analyzing the imported data, it was determined that there were 131662 rows and 14 columns. Some of the columns contained null values, which were replaced with zeros using the "Replace" function.
-
Visualizations: A variety of visualizations, including charts, graphs, cards, and tables, were created in Power BI Desktop to clearly and effectively present the data. These visualizations were chosen based on their suitability for displaying the relevant information and for ease of understanding by the intended audience.
Analysis
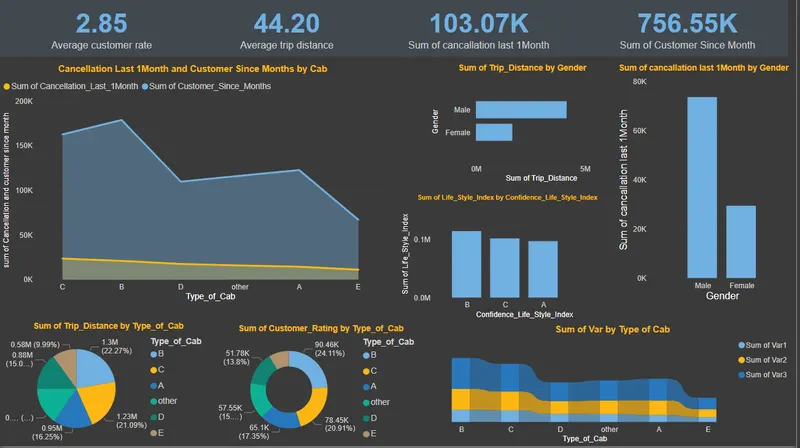
"The following analyses were conducted on the collected data:
-
Average Customer Rating and Average Trip Distance: New measures were created and the average DAX function was used to analyze the average customer rating and average trip distance. The resulting data was presented using cards.
-
Total Cancellations and Total Customers: The total number of cancellations that occurred last month and the total number of customers since the beginning of the month were analyzed. The results were displayed using cards.
-
Cancellations by Gender: The number of cancellations that occurred last month was analyzed by gender. It was found that male customers had a higher number of cancellations (74k) compared to female customers (29k).
-
Trip Distance by Cab Type: The trip distance was analyzed according to the different types of cabs. It was found that type B cabs traveled the greatest distance, followed by type C and type A.
-
Customer Rating by Cab Type: The customer rating was analyzed according to the different types of cabs. It was found that type B cabs had the highest rating, followed by type C and type A.
-
Lifestyle Index by Confidence Lifestyle Index: The lifestyle index was analyzed according to the confidence lifestyle index. It was found that type B had the highest number of lifestyle indexes, followed by type C and type A.
-
Sum of All Variables by Cab Type: The sum of all three variables (average customer rating, average trip distance, and lifestyle index) was analyzed according to the different types of cabs. It was found that type B cabs had the highest values in all three cases, followed by type C and type D.
-
Total Trip Distance by Gender: The total trip distance traveled was analyzed by gender. It was found that male customers traveled a greater distance than female customers.
-
Cancellations and Customers by Cab Type: The sum of cancellations last month and the sum of customers since the beginning of the month were analyzed according to cab type. It was found that type B cabs had the highest number of customers, while type C cabs had the highest number of cancellations.
-
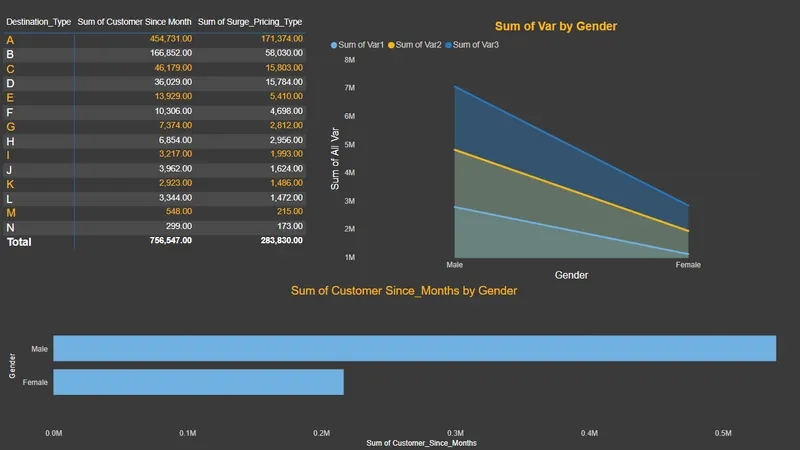
Customers and Surge Pricing by Destination Type: The number of customers and the surge pricing type were analyzed according to the destination type. It was found that destination type A had the highest number of customers and the highest number of surge pricing instances, followed by destination type B and destination type C.
-
Customers by Gender: The number of customers was analyzed by gender. It was found that male customers outnumbered female customers.
-
Sum of Variables by Gender: The sum of the different variables (average customer rating, average trip distance, and lifestyle index) was analyzed by gender. It was found that the sum of these variables was higher for male customers compared to female customers.
Insights
"The data analysis conducted in this project revealed several key insights about Sigma Cabs' operations and customer preferences:
-
Average Trip Distance and Average Customer Rating: The analysis of the average trip distance and average customer rating provided insight into the typical distance that customers prefer to travel and the level of satisfaction with Sigma Cabs' services. This information can be used to improve future operations and enhance the customer experience.
-
Customer Rating and Trip Distance by Cab Type: The analysis of the customer rating and trip distance according to cab type allowed us to understand which types of cabs are most popular among customers. This information can inform our decision-making regarding which types of cabs to prioritize in the future.
-
Customers and Cancellations by Gender: The analysis of the number of customers and cancellations by gender revealed which gender uses Sigma Cabs' services more frequently. This information can help us tailor our marketing and customer service efforts to better serve our diverse customer base.
-
Destination Type: The analysis of the destination type chosen by customers indicated which destinations are most popular and may require more cabs. This information can inform our deployment and resource allocation decisions."
Recommendations
Based on the insights gained through the data analysis, the following recommendations are proposed for Sigma Cabs:
-
Increase the number of type B cabs: The analysis showed that type B cabs are the most popular among customers in terms of both distance traveled and customer rating. Increasing the number of type B cabs in the fleet would likely lead to increased profitability for Sigma Cabs.
-
Target female customers through advertising: The analysis revealed that male customers use Sigma Cabs' services more frequently. Targeting female customers through targeted advertising campaigns could help to increase the number of female customers and improve gender balance among Sigma Cabs' customer base.
-
Increase the number of cabs serving destination type A: Destination type A was found to be the most popular among Sigma Cabs' customers. Increasing the number of cabs serving this destination could lead to increased profitability for the company
Conclusion
In conclusion, the data analysis conducted in this project has provided valuable insights into Sigma Cabs' operations and customer preferences. By following the recommendations outlined in this report, Sigma Cabs can make informed decisions to drive positive change and increase profitability. Continuous improvement and refinement of business strategies will be key to the company's success in the future.
power point link
https://1drv.ms/p/s!AtChEQM3R9BLaWBe1H8jmg01EKs?e=uBdYyQ