Project 2 - Supply and Demand Gap Analysis
***** Please View Word Document for Proper Report ********
AIM
The aim is to identify and analyse the gap between Supply-Demand of Uber trips and find out possible solutions to address the problem.
INTRODUCTION
We are going to explore Uber request dataset which is recently (4 months ago) uploaded on Kaggle. In it’s many of its users face the problem of cancellation by driver or non-availability of cars. So, our main object is to find out possible solution for that.
METHODOLOGY
- Data Understanding
- Import and Cleaning process
- Create graphs for visualization and know the purpose of those graphs
- Data Importing
- With help of Get Data option under the home tab we are importing csv file.
- With help of transforming data, we do necessary changes.
- Now click on Load and save data.
- Data Cleaning
- After Import data, we have gone for data cleaning Process.
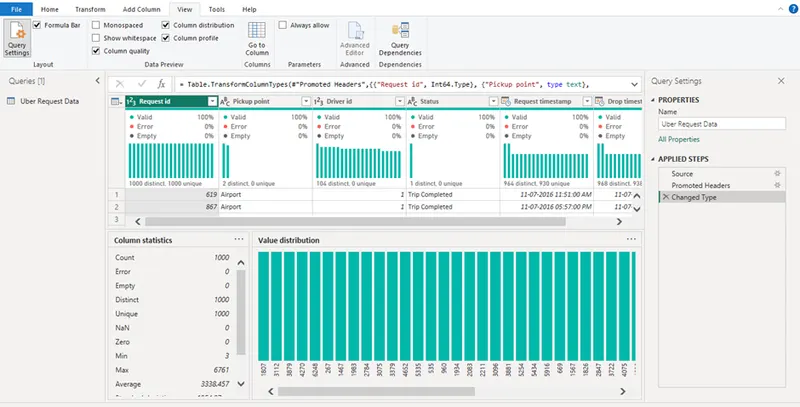
- With help of Power Query Editor, we will find missing values, any data errors, any data type mismatch etc.
- Create Visualization
- First, we create Snapshot view using Card visual. Which is include:
- of request per Hours and Status
- of request per Hours and Pickup point
- Analysis - Time Slots
- Analysis — Demand, Supply and Gap in the City
- Analysis — Demand, Supply and Gap in the Airport
- of request per Hours and Status
- First, we try to find out No. of request per Hours and Status with help of Clustered Chart
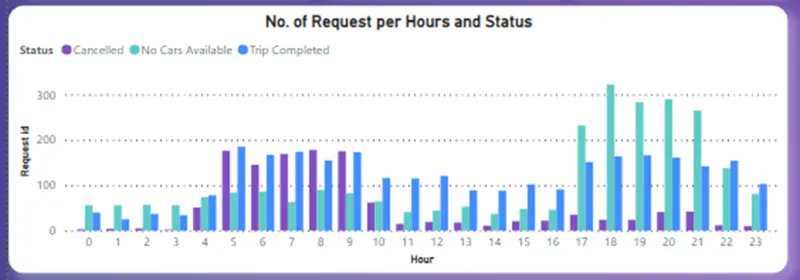
- Based on this visualization we conclude:
1.In this plot, we see that the time slots between 5.00 to 9.00 and 17.00 to 21.00 are particularly busy with more demand.
- It is also seen that between 5.00 to 9.00 time slot, there are a greater number of cancelled Cars.
- Between 17.00 to 21.00 time slot, there are a greater number of No Cars Available
- of request per Hours and Pickup point
- First, we try to find out No. of request per Hours and Pickup point with help of Clustered Chart
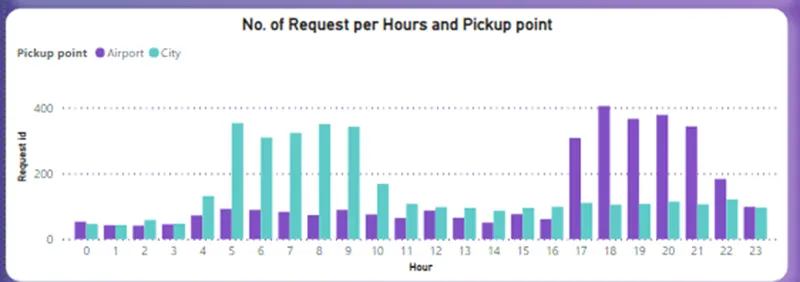
- Based on this visualization we conclude:
- From this plot, it is clear that between 5.00 to 9.00 time slot, there are a greater number of requests in the City.
- Between 17.00 to 21.00 time slot, there are a greater number of requests from Airport.
- Analysis - Time Slots
- To carry out further analysis, we create time slots based on the number of trips.
- From our observations from previous plots, we notice that the times between 5.00 to 9.00 and 17.00 to 21.00 have high request.
- We can make various time slots like:
5.00 to 09.00 - Peak Morning
17.00 to 22.00 - Peak Evening
Others - No Pick Time
- From the plot it is confirmed that in the Peak Morning time slot, there are more number of cancelled cabs.
- In the Peak Evening time slot, there are more number of “No Cars Available”.
- Analysis — Demand, Supply and Gap in the City
We assume that:
▪ Demand = Total No. of Requests
▪ Supply = Total Number of Completed Trips
▪ Gap = Demand — Supply
▪ “Cancelled” and “No Cars Available” are Gaps
▪ “Trip Completed” is Supply.
We observe:
▪ Demand or Total Requests = 1677
▪ Supply or Trips Completed = 472
▪ Gap = 1205 (71.85%)
- Analysis — Demand, Supply and Gap in the Airport
We observe:
▪ Demand or Total Requests = 1983
▪ Supply or Trips Completed = 453
▪ Gap = 1530 (77.16%)
CONCLUSION
- Peak Morning
- We observed that in the Peak Morning Slot where the demand for City to Airport trips are high, there are maximum number of trip cancellations leading to great Gap in the Demand & Supply.
- Once the driver is in the Airport, he will have a longer idle time depending on the on the flights. In the mornings, a lot of flights usually leave the city and less flights arrive. Also, it doesn’t make any economic sense to come back empty from the Airport to the City.
- All these factors lead to high cancellation rate for trips from City to Airport.
- Peak Evening
- We observed that in the Peak Evening Slot where the demand for Airport to City trips are high, there are maximum number of “No Cars Available” leading to great Gap in the Demand & Supply.
- This is because by the night, a lot of flights including the international ones start arriving at the airport. This creates a high demand for the cars.
- These factors lead to high “No Cars Available” issue for trips from Airport to City.
RECOMMENDATIONS TO RESLOVE GAP
- Provide higher incentives for driver taking a Peak Morning trip from City to Airport.
- Setting targets for drivers to take up the City to Airport or Airport to City trips and then rewarding them through gift vouchers or something else.
- Incentivize Airport to City trips in the night so that more drivers from the city reach the Airport thus increasing the availability of the cars.
- Conduct orientation classes for drivers and let them know about the insights obtained analysis of this problem so that the drivers know where to be at what time of the day.