Project 1 - COVID-19 Vaccinations Trend Analysis
AIM
Covid Vaccination Process Case Study using Power BI.
INTRODUCTION
We are going to explore Covid vaccination dataset and try to find out how the immunization process is going.
METHODOLOGY
- Data Understanding
- Import and Cleaning process
- Create Relationship
- Create graphs for visualization and know the purpose of those graphs
Data Importing
- With help of Get Data option under the home tab we are importing csv file.
- With help of transforming data, we do necessary changes.
- Now click on Load and save data.
- Data Cleaning
- After Import data, we have gone for data cleaning Process.
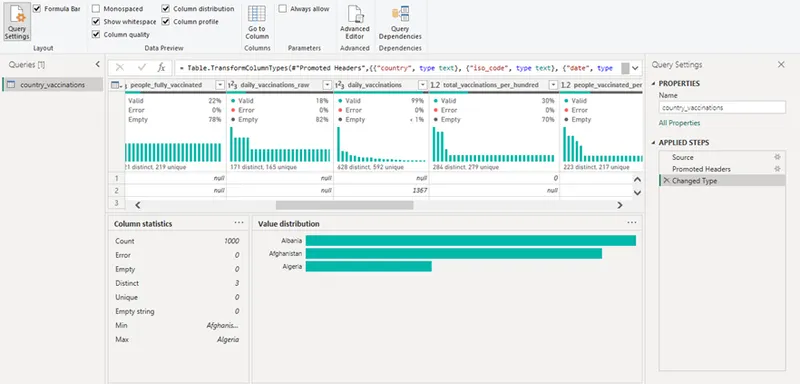
- With help of Power Query Editor, we will find missing values, any data errors, any data type mismatch etc.
- In this data, daily_vaccination_raw column contains 82% empty rows, whereas daily_vaccinations column contains only less than 1% empty rows. So, we can remove daily_vaccination_raw column.
- Create Relationship
- We have created one New Table using CALENDARAUTO ()
- Click on the date column of the country_vaccinations table, then drag & drop to the date column of the Date Table.
- One to Many Relationships is created between two tables and Cross filter direction is Date Table to country_vaccinations table.
- Create Graphs
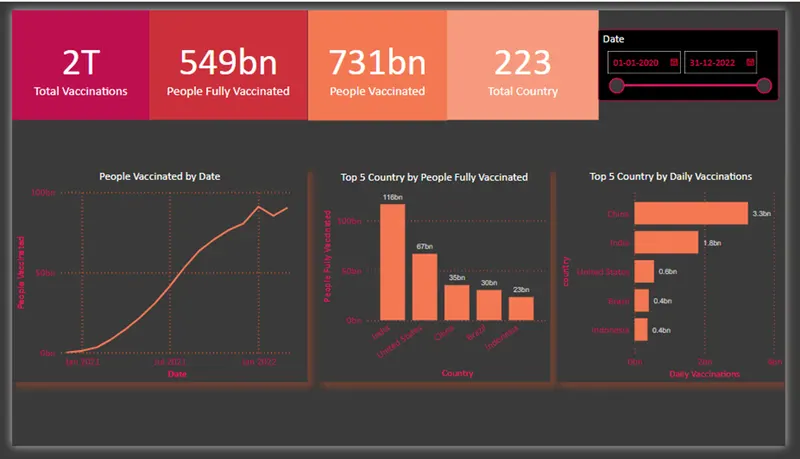
- First, we create Snapshot view using Card visual. Which is include:
- Total Vaccination
- People Fully Vaccinated
- People Vaccinated
- Total Country
- Then we add Slicer for Date
- After that create Line graph for People Vaccinated by Date
- Then create Clustered column chart for Top 5 Country by People Fully Vaccinated
- Finally, we create Clustered bar chart for Top 5 Country by People Fully Vaccinated
INSIGHTS
CONCLUSION
We have completed case study of Covid Vaccination Process in Power BI and created different types of graphs based on results.