Challenge

Project 2 - Supply and Demand Gap Analysis

Aim : Analysing Uber Supply & Demand Gap.

Introduction :

The aim of analysis is to identify the root cause of the problem (i.e. cancellation and non-availability of cars) and recommend ways to improve the situation. As a result of our analysis, we should be able to present to the client the root cause(s) and possible hypotheses of the problem(s) and recommend ways to improve them.

Problem Statement :

We may have some experience of travelling to and from the airport. Have you ever used Uber or any other cab service for this travel? Did you at any time face the problem of cancellation by the driver or non-availability of cars?

Well, if these are the problems faced by customers, these very issues also impact the business of Uber. If drivers cancel the request of riders or if cars are unavailable, Uber loses out on its revenue.

Methodology :

The following are the methods that can be used to get meaningful insights from the given dataset :

  • Pie Chart of Pickup point (Airport/City) by Status of Journey (Trip completed/No Cars available/Cancelled)
  • Bar graph of Day of week and Status of Journey (Trip completed/No Cars available/Cancelled)
  • Donut Chart of count of Status (Trip completed/No Cars available/Cancelled)
  • Bar chart of Status of Journey (Trip completed/No Cars available/Cancelled) by Pickup point
  • Bar chart of Pickup point (Airport/City) by Day of week
  • Bar chart of Working days of Uber drivers

Analysis : The following are the key visual insights obtained from the dataset.

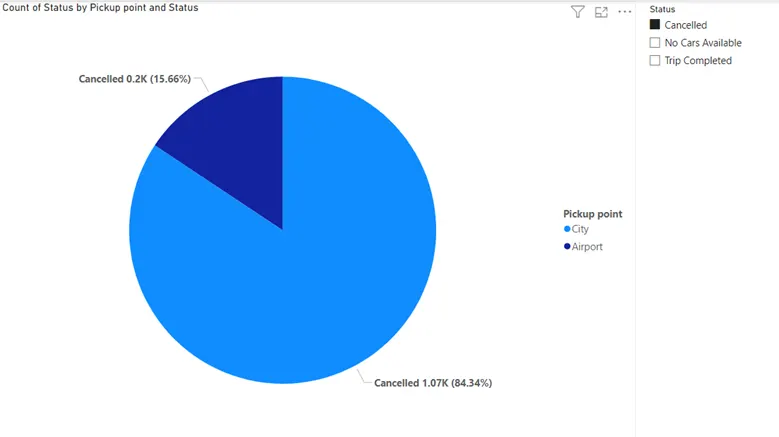
  • Pie chart of Pickup point (Airport/City) by Status of Journey (Trip completed/No Cars available/Cancelled)

From the above pie chart, we observed that most of the uber rides were cancelled from airports and not from cities.
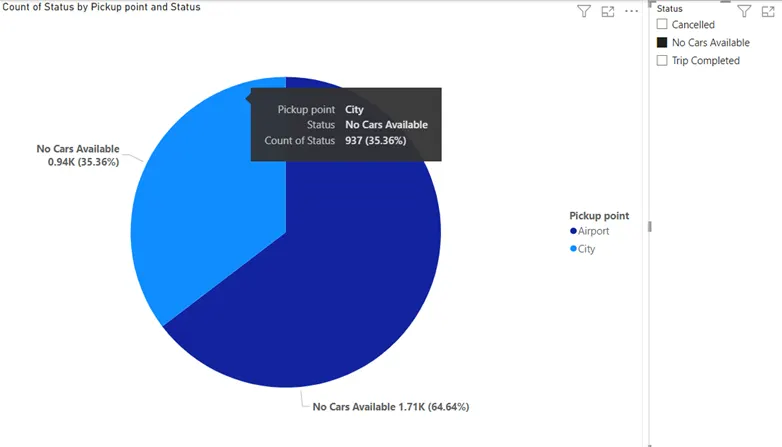
Not in cities but at airport most of the people struggled to book a ride as there were no cars available.
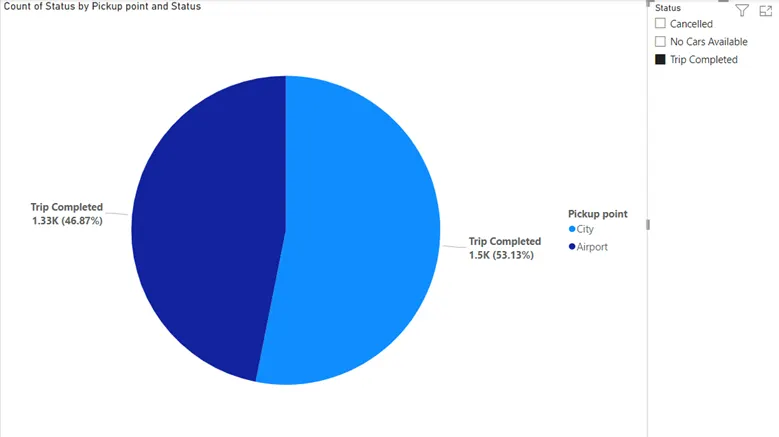
Cities(53.13%) remain slightly on the better side in terms of Trip completed as compared to airports (46.87%).

  • Bar graph of Day of week and Status of Journey (Trip completed/No Cars available/Cancelled)
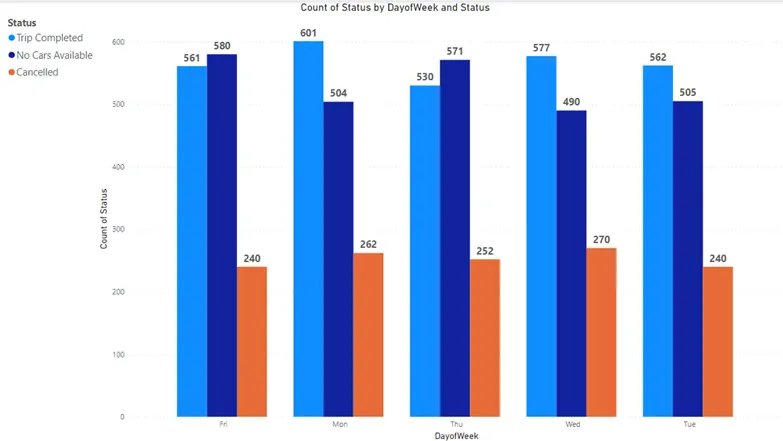
From the above bar chart, we observed that on Monday maximum trips got completed, on Wednesday maximum trips got cancelled, people suffered while booking a ride because maximum cars was not available on Friday.

  • Donut Chart of count of Status (Trip completed/No Cars available/Cancelled)
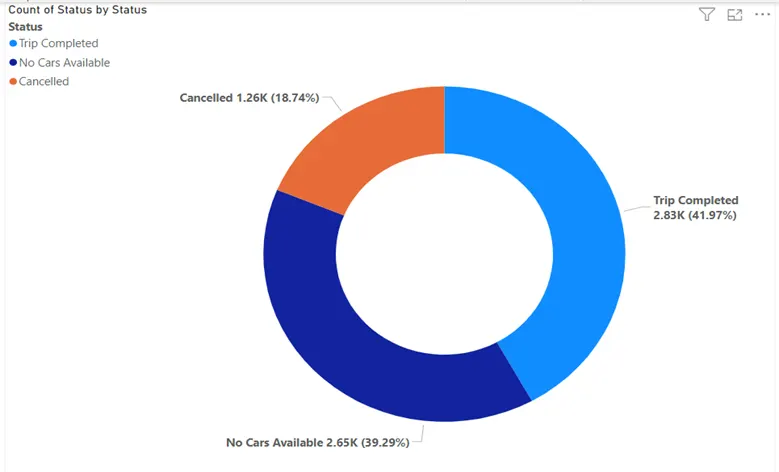
The donut chart states that among the status of trip, most(41.97%) of the trip got completed followed by 39.29% of the people could not book a ride as there were no cars available and rest of the ride were cancelled.

  • Bar chart of Status of Journey (Trip completed/No Cars available/Cancelled) by Pickup point
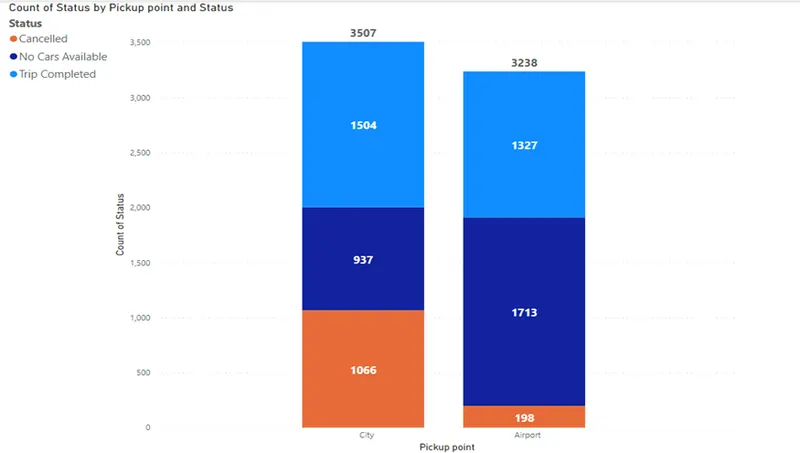
From the bar chart it is observed that at airport very less number of trip were cancelled compared to cities. People suffered lack of availability of uber cars most at the airport. Most of the trip completed was observed in cities compared to from airports.

  • Bar chart of Pickup point (Airport/City) by Day of week
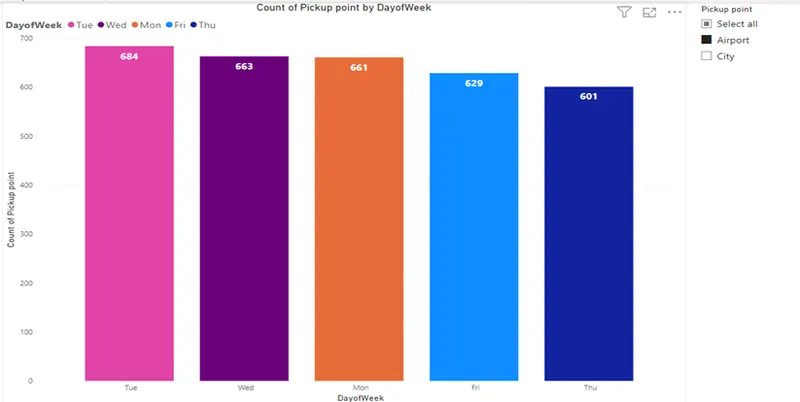
From the bar chart it is observed that the pickup point from airport was highest on Tuesday and lowest on Thursday.
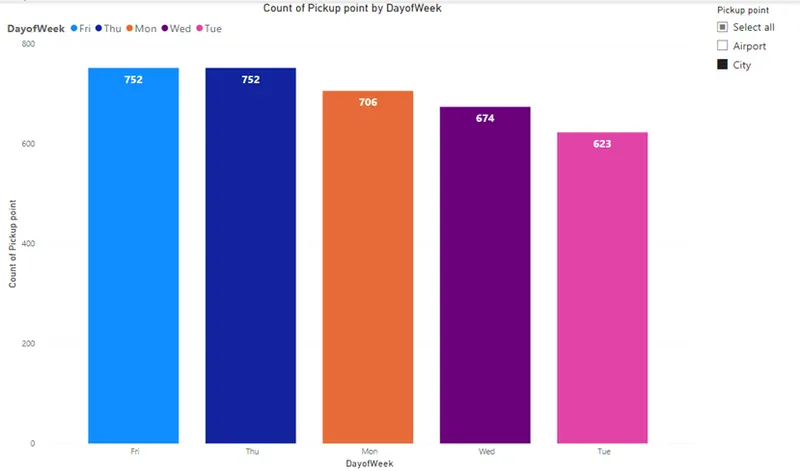
And the pickup point from city was highest on Friday and lowest on Tuesday.

  • Bar chart of Working days of Uber drivers
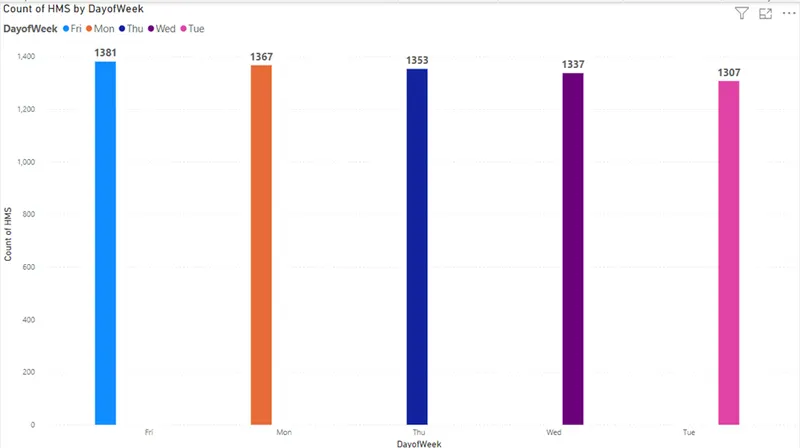
The above chart depicts that on Friday and Monday was the busiest day for uber drives as they got highest number of requests for the trip and least on was on Tuesday.

Insights :

From the analysis of the Uber Supply & Demand Gap dataset, it is evident that most Uber rides were cancelled at airports rather than in cities. This indicates that many people faced difficulties in booking a ride from airports due to the unavailability of cars. In contrast, cities showed a slightly better performance in terms of completed trips compared to airports. This suggests that while cities had a higher rate of trip completion (53.13%), airports experienced a lower rate (46.87%).

Furthermore, the analysis of the bar chart reveals interesting patterns in terms of days of the week. Mondays recorded the maximum number of completed trips, indicating a high demand for Uber rides at the beginning of the week. Wednesdays, on the other hand, witnessed the highest number of trip cancellations, indicating potential challenges in securing a ride during the middle of the week. Fridays exhibited a significant lack of car availability, causing difficulties for users trying to book a ride.

The donut chart presents the distribution of trip statuses, highlighting that most trips (41.97%) were successfully completed. However, a significant portion of users (39.29%) faced the problem of unavailability of cars when attempting to book a ride. The remaining trips were cancelled. Comparing the pickup points, the bar chart indicates that cancellations were relatively lower at airports compared to cities. The lack of car availability was predominantly observed at airports, while cities had a higher number of completed trips. Additionally, the chart reveals that pickup requests from airports were highest on Tuesdays and lowest on Thursdays. Conversely, pickup requests from cities peaked on Fridays and were lowest on Tuesdays. Overall, the data suggests that Fridays and Mondays were the busiest days for Uber drivers, as they received the highest number of trip requests, while Tuesdays experienced the least demand.

Recommendation :

Improve Car Availability at Airports: Since a significant number of Uber rides were cancelled at airports due to unavailability of cars, it is crucial for Uber to address this issue. Allocating more vehicles to airport areas during peak times and optimizing driver distribution based on demand patterns can help ensure a smoother ride-booking experience for passengers at airports.

Enhance Supply-Demand Management: The data indicates that Wednesdays experienced the highest number of trip cancellations and Fridays faced challenges with car availability. Implementing proactive measures such as predictive analytics and demand forecasting can assist Uber in balancing the supply and demand more effectively. This would involve allocating resources and drivers strategically to meet anticipated demand, especially on days when the likelihood of cancellations or limited car availability is higher.

Optimize Operations in Cities: While cities performed relatively better in terms of trip completion, there is still room for improvement. Uber can focus on reducing the cancellation rate in cities by analysing the reasons behind cancellations and taking appropriate measures. Providing incentives to drivers who consistently complete trips in cities can help enhance customer satisfaction and encourage drivers to accept and fulfil ride requests.

Promote Balanced Distribution of Trips: The analysis reveals that certain days, such as Mondays and Fridays, experience a higher demand for Uber rides. To ensure a balanced distribution of trips throughout the week, Uber can introduce incentives for riders to schedule their trips during off-peak hours or on less busy days. This would help alleviate the strain on drivers and prevent overwhelming demand on specific days.

Improve Communication with Passengers: When cars are unavailable or trips are cancelled, it is crucial to provide clear and timely communication to passengers. Uber should enhance its in-app messaging system to inform users promptly about any disruptions or unavailability of cars, along with alternative options or estimated waiting times. Transparent and proactive communication can help manage passenger expectations and mitigate frustrations.

Conduct Regular Driver Training: To address the challenges related to trip cancellations, unavailability of cars, and overall service quality, Uber should invest in regular training programs for drivers. This training should emphasize the importance of accepting and completing rides, maintaining reliable availability, and adhering to service standards. By nurturing a dedicated and reliable driver network, Uber can enhance the overall experience for passengers.

Conclusion :

In conclusion, the analysis of the Uber Supply & Demand Gap dataset highlights the challenges faced by users in booking rides from airports due to car unavailability, while cities showed slightly better trip completion rates. To address these issues, Uber should focus on improving car availability at airports, optimizing supply-demand management, and enhancing operations in cities. Implementing proactive measures, promoting balanced trip distribution, and improving communication with passengers are key areas to prioritize. Additionally, regular driver training can contribute to reducing trip cancellations and maintaining a reliable driver network for an improved customer experience.

Your portfolio, next

Ship work like this
in your own course.

Talk to a career counsellor

Free 20-minute call. We'll map the right course to where you want to work.

By submitting you agree to our Terms and Privacy Policy.