Project 2 - Supply and Demand Gap Analysis
|
AGENDA:
Identify any imbalances between the number of drivers (supply) and the number of passengers (demand) on the Uber platform. To develop recommendations to address those imbalances.
|
|
METHODOLOGY: |
|
COLUMNS IN DATASET: · Request id · Pickup point · Driver id · Status · Request timestamp · Drop timestamp. |
|
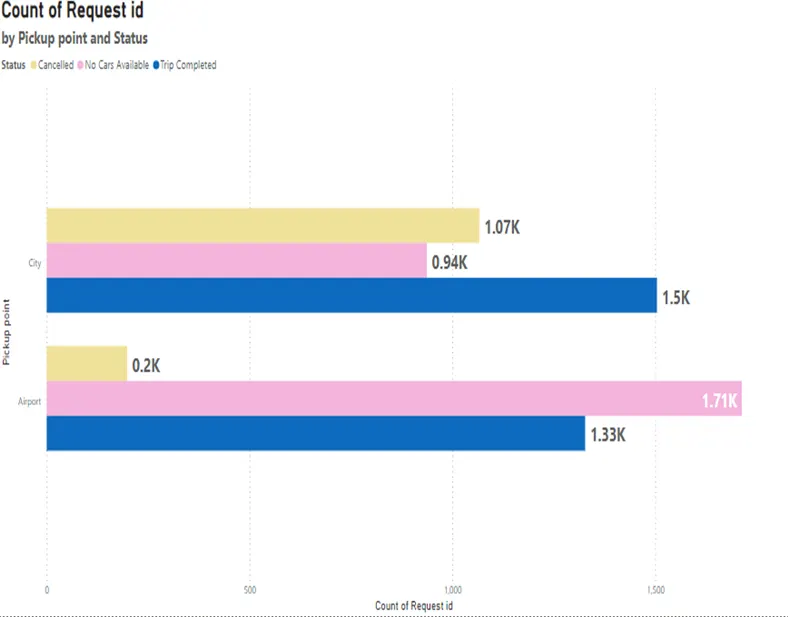
What are total requests by pickup point:
|
|
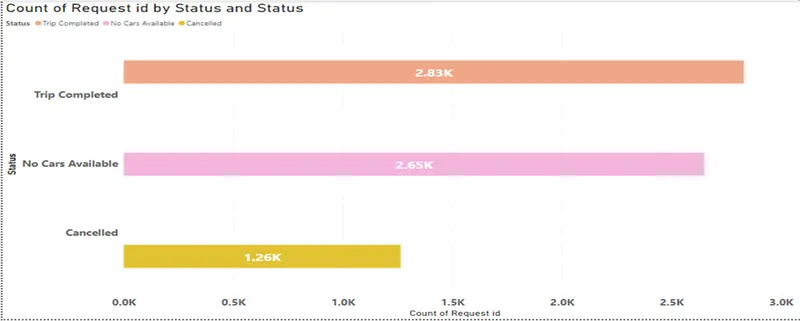
What are total requests by status:
|
|
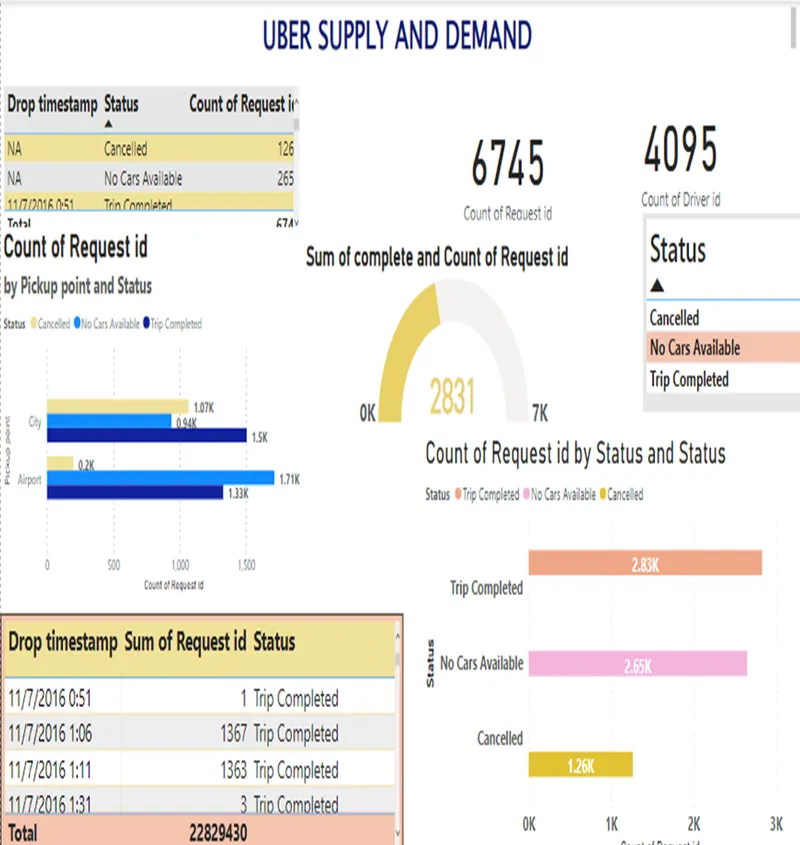
Count of Requests and Drivers: No Cars Available had 2,650 Count of Request id and 1 Count of Driver id. Trip Completed had 2,831 Count of Request id and 300 Count of Driver id. Cancelled had 1,264 Count of Request id and 295 Count of Driver id.
|
|
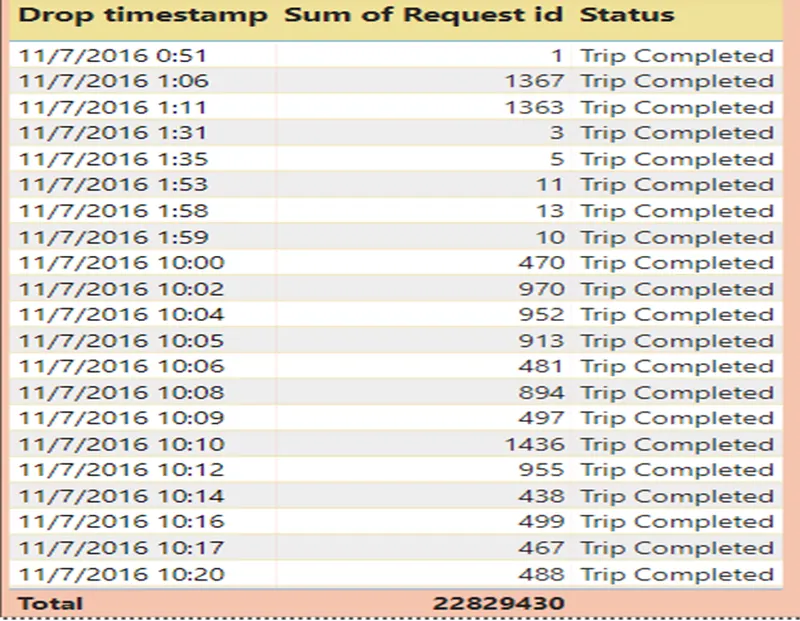
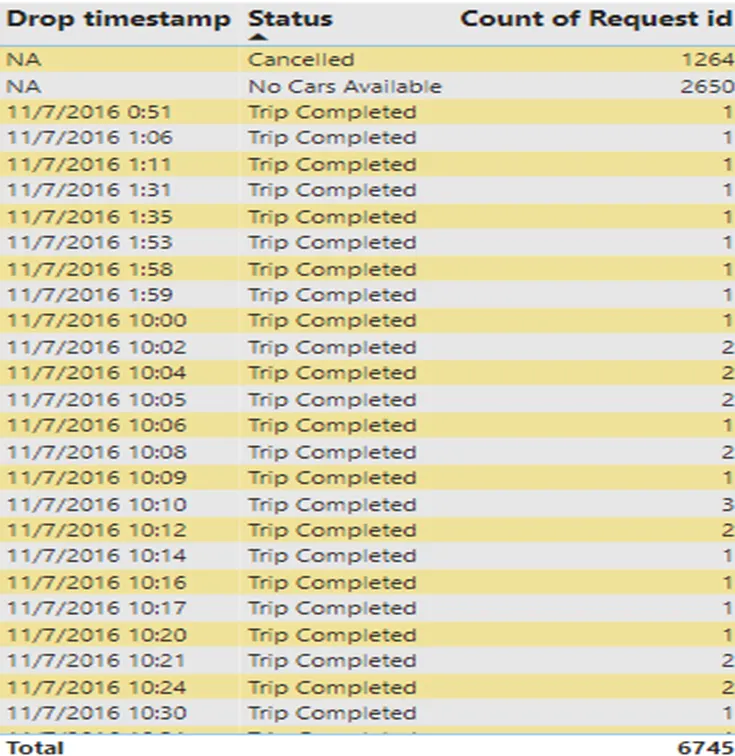
What is the Demand by DROP date:
|
|
Demand by Request Date:
DASHBOARD:
|
|
INSIGHTS:
1. There were more requests for cab bookings in the dataset that were either cancelled or faced unavailability of cars as compared to the requests that were successfully completed. 2. The number of unique drivers who participated in the dataset is relatively small, with only one driver being available for the "No Cars Available" status, while the highest number of drivers (300) were available for the "Trip Completed" status. 3. The most frequent status for the cab booking requests in the dataset is "Trip Completed", with 2,831 such requests being recorded. 4. On average, there were more requests for cab bookings that faced unavailability of cars ("No Cars Available") as compared to the requests that were cancelled. 5. The highest average count of request ID was recorded for the "Trip Completed" status, indicating that more cab bookings were completed on average as compared to the other statuses.
|
|
CONCLUSION:
• We can conclude that the cab booking industry faces common challenges such as unavailability of cars and cancellation of bookings. However, it is encouraging to note that the "Trip Completed" status has the highest count of request ID and average count of request ID, indicating that more cab bookings were completed on average as compared to the other statuses. • The data also suggests that there is a small pool of drivers available for the cab booking requests in the dataset. This could be an area of concern for the cab booking companies as it may affect the availability of cars for the users. • Overall, the insights from the given data can be used by the cab booking companies to optimize their operations, enhance the user experience and address the challenges faced by the industry.
CASE STUDY
BY MADHURI KADUKAR. |