Project 2 - Supply and Demand Gap Analysis
Selection of Dataset for supply and demand when i searched for dataset i didn'tmention any specificdomain but the result is only on cab service
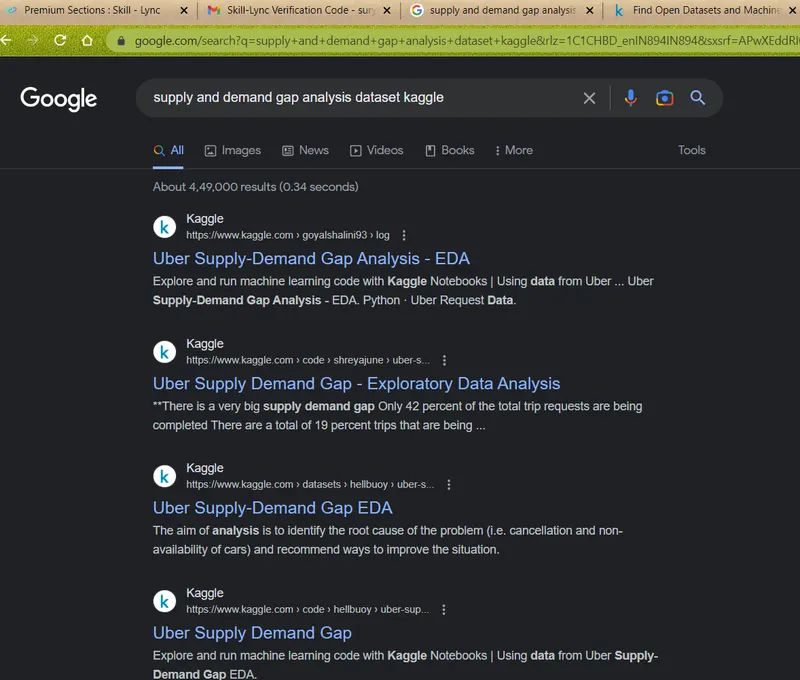
So, i chose UBER data set from following link
https://www.kaggle.com/datasets/hellbuoy/uber-supplydemand-gap
UBER-Supply and Demand Gap Analysis
AIM:
Aim is to analyse tha supply and demand Gap dataset of cab services to take action to minimise those gaps.
INTRODUCTION:
Creating a dashboard that provides a comprehensive overview of supply and demand gap analysis and this dataset include data on the number of drivers, pickup points, trip status, request and drop time. The objective is to identify and analyse the problems in Supply-Demand of Uber trips from City to Airport and vice-versa across various hours of the day.
PROBLEM STATEMENT:
In this Dataset, Lots of rquest id cancelled by customers and also cancelled bue to no cars available to improve this we following dataset also we only having the status in that cancelled trip we want reason or feedback data because we don't know why they cancelled then how could we supply more cabs, we only having the data of week days if we have week end data (saturday and sunday) to find out the difference based on week days and week end days
Methodology:
Import the uber supply and demand gap analysis data to Power BI desktop
Data Cleaning:
Clicking on Transform Data under the Home tab and go to Power Query Editor and then find out data errors and data type miss match and cleaned before starting visualization
Data Visualization:
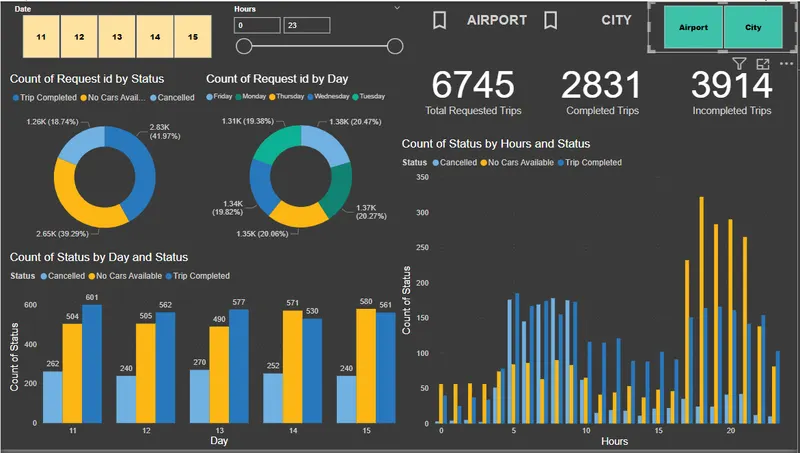
Create a measure for cancelled trips and create a cards for following three total requested trips and completed trips and cancelled trips

3914 Incompleted trips on 5 days its more than half of the requested requested trips
Create a clustered column chart according to day wise status and creating slicer  for followed chart
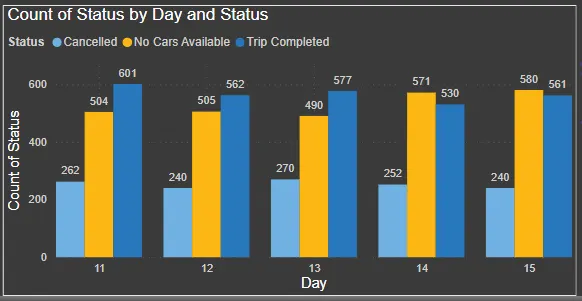
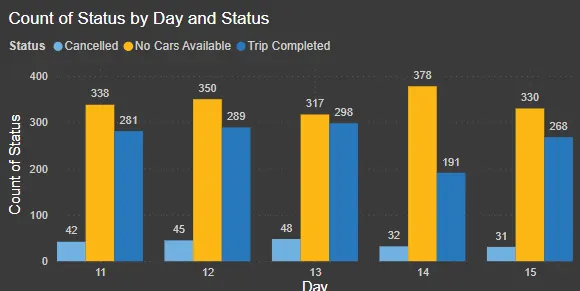
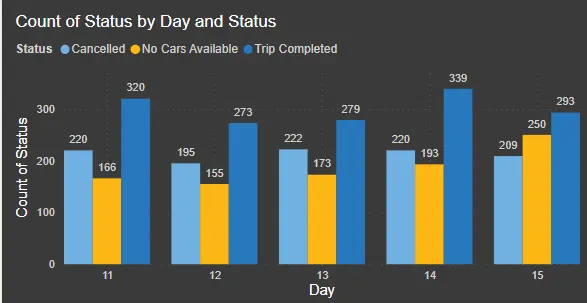
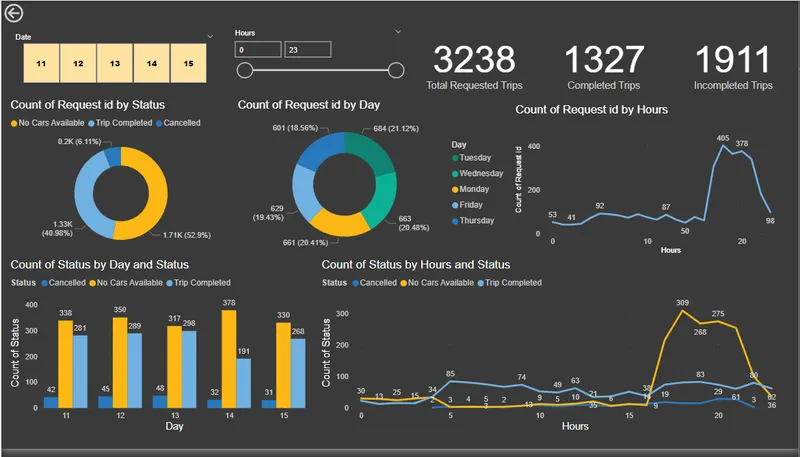
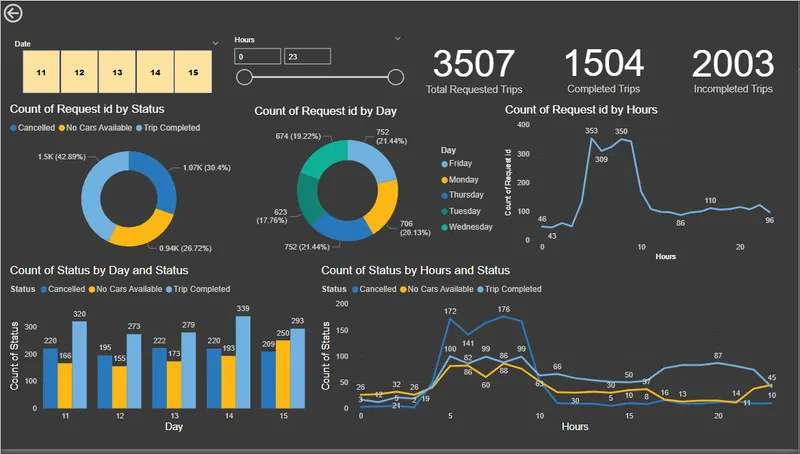
Every day most of request are cancelled by reason of cars not available and mainly in airport when compare to city
Creating again a clusterd chart for hour wise status report and for hours slicer create a column for hours from requested time stamp

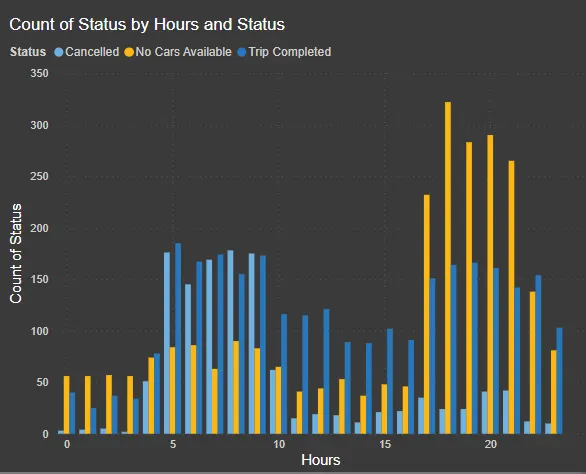
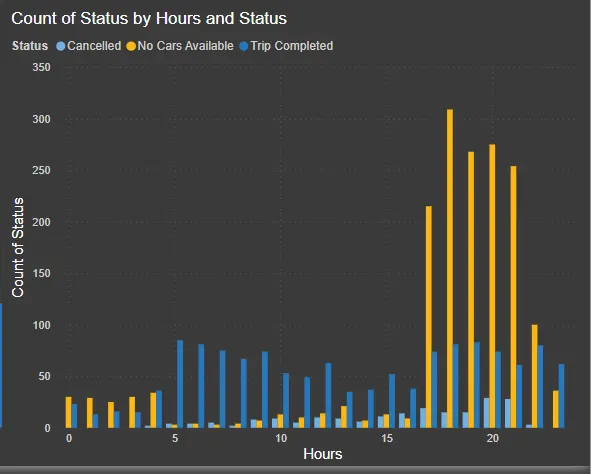
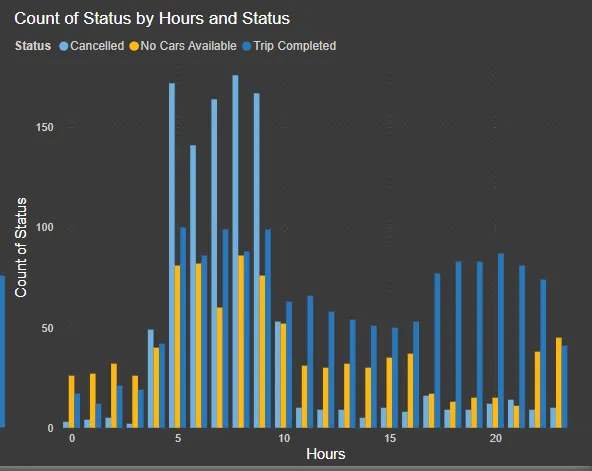
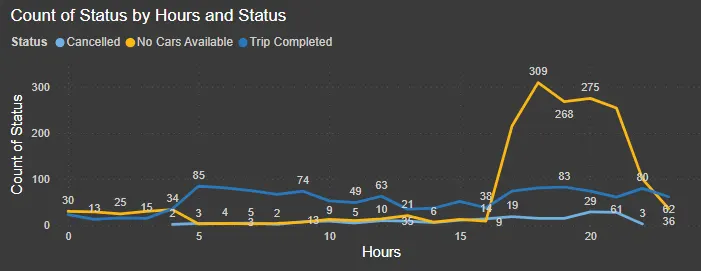
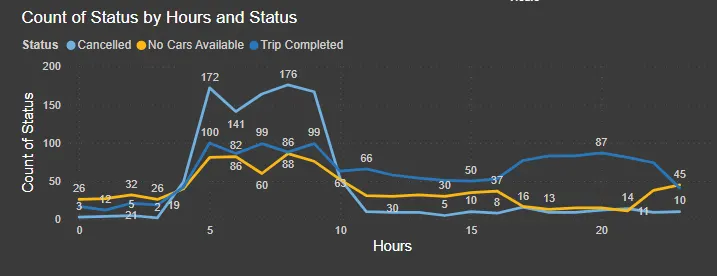
Here cars are mostly not available in airport in the time between 5pm to 9pm and most of request cancelledby customer on morning 5 amto 9 am
Same requested number also higher at same time and same place based on aiport and city
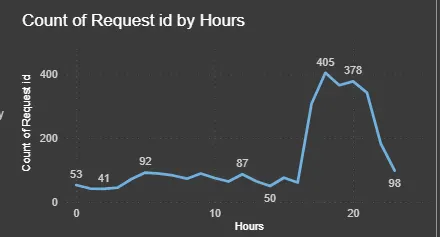
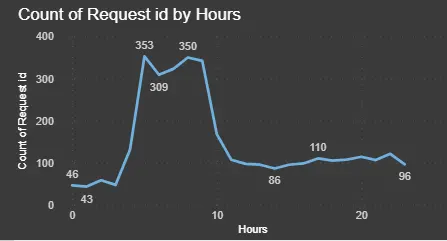
Create a donut chart For request number based on day how many percentage are completed and incompleted can differentiated as not available cars and cancelled cars and also donut chart for monday to friday report how many request percentage goten to find out is there any difference on day wise request
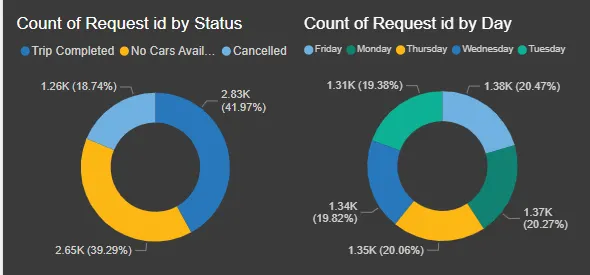
By above visualization Cancellationis lower than no cars available and also is aproximately equalto completed trips
and by day wise report request number is equal in every day ther is no difference in request
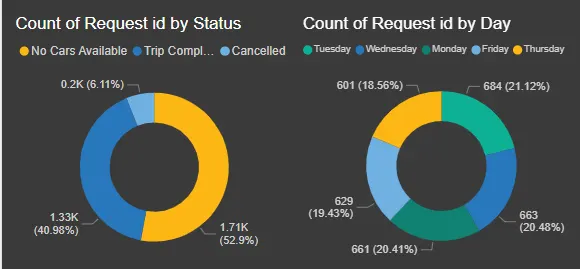
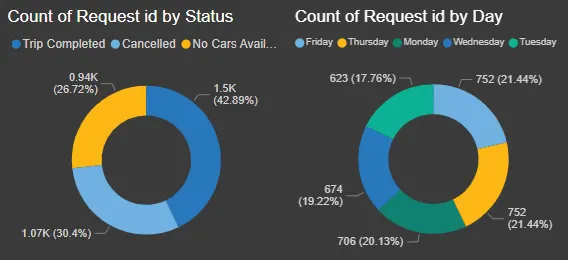
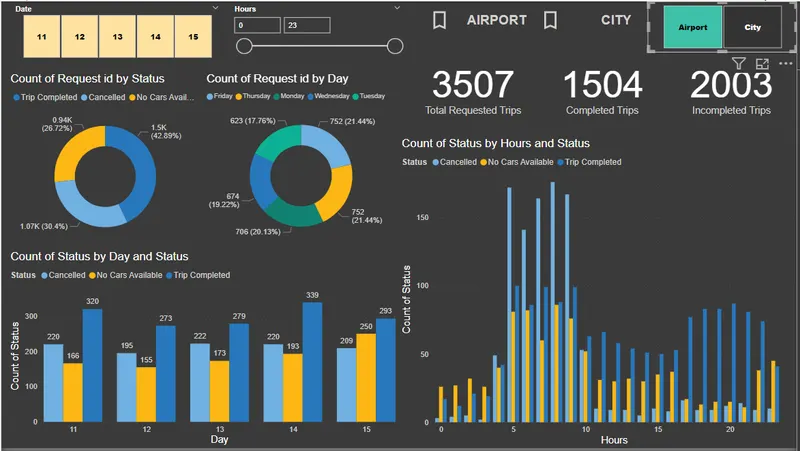
According to airport view no cars available is higher then completed trips and cancellation is too low and by city report cncellation and nocars available are mostly equal and completed trips also not higher only 10% are higher then cancellation according to city report mostly cars are available but customers are cancelled the cabs
using Bookmark and button created another two dashboard with drill through filter on page level for airport and city
Analysis:
AIRPORT VIEW
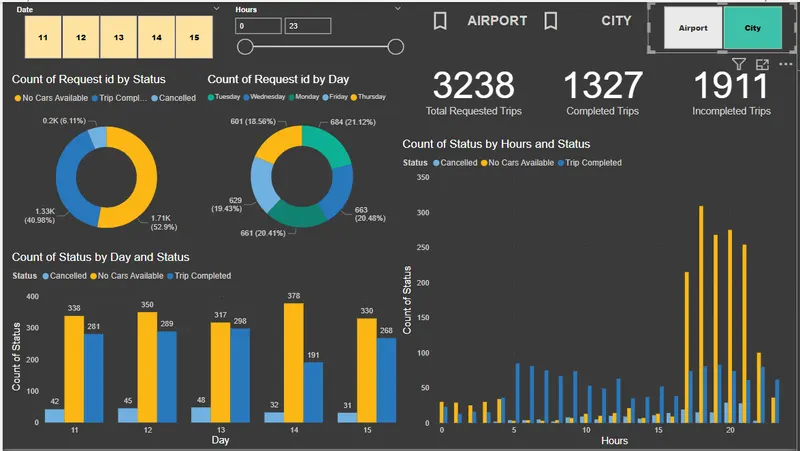
CITY VIEW
- There are totally 301 drivers available and 6745 requested are done as per the given dataset
- High demand for cabs in 5pm to 9pm from airport at low cancellation
- High Cancellation for cabs in 5am to 9am from city
- There are 41.97% of trips are successfully completed and the remaining 58.03% and unsuccessful due to No Cars Available 39.29% and Cancelled 18.74%
Insights:
- Considering the status of the requests in the city at 5am to 9 am we can see that the unsuccessful requests are mainly due to the cancellation of the rides.
- Considering the status of requests in the airport peak 5pm to 9 pm we can see that unsuccessful requests are mainly due to the unavailability of the cars.
Recommendations:
- By increasing the count of the cabs can resolve this gap
- By given rewards to the customer takes the trip on the peak time can avoid the cancellations of the trip
- Incentivize to the drivers who takes trip from Airport to City in the night so that more drivers from the city reach the Airport thus increasing the availability of the cars
Conclusions
In conclusion, the report has identified two significant issues impacting the performance of service, higher in cancellations from 5 am to 9 am for requests from City, and unavailablity cabs in the Airport area after 5pm to 9pm. These issues are likely causing frustration for both passengers and drivers. If we corrected those two issues we will increase number of completed trips for success of our business.