Project 2 - Rankine cycle Simulator
The aim is to create a rankine cycle simulator,
Rankine cycle : it is an idealized thermodynamic cycle describing the process by which certain heat engines, such as steam turbines or reciprocating steam engines, allow mechanical work to be extracted from a fluid as it moves between a heat source and heat sink.
process 1-2 : isentropic expansion
process 2-3 : constant pressure heat rejection
process 3-4 : isentropic compression by the pump
process 4-1 : constant pressure heat addition
the initial input are given from the question,
and the code is calculated and finally plotted ,
% Print Process Description
fprintf('1-2 Isobaric heat Transfer\n')
fprintf('2-3 Isentropic Expansion\n')
fprintf('3-4 Isobaric heat Rejection\n')
fprintf('4-1 Isentropic Compression\n')

%step 1:Enter Inputs
p1 = input('enter the Pressure at the Turbine Inlet (in bar):');
T1 = input('Enter the Temperature at the Turbineinlet (in Degree Celcius');
p2 = input('enter the Pressure at the Condensor (in bar):');


%step 2: Calculate each state point values.

% state point 1 Schedule Now
h1 = xSteam('h_pt',p1,T1);
sl = xSteam('s_pt',p1,T1);
%step 3: state point 2
s2=s1;
sf2 = XSteam('sl_p',p2);
sg2 = XSteam('sV_p',p2);
hf2 = xSteam('hL_p',p2);
hg2 = XSteam('hV_p',p2);   %x2 = (s2-sf2)/(sg2-sf2);
s2 = sg2;
h2 = hg2;       %hf2 +(x2*(hg2-hF2));
T2=xSteam('T_hs' ,h2,s2);
step 4: state point 3
T3=T2;
p3= p2;
s3=XSteam('sL_T',T3);
h3=XSteam('hL_T',T3);

%step 5: state point 4
p4 =pl;
s4= s3;
Cp4 = xSteam('Cp_ps',p4,s4);
Cv4 = xSteam('Cv_ps',p4,s4);
gamma = Cp4/Cv4;
r = (gamma - 1)/gamma;
T4 = 13 *(p4/p3)^r;

%step 6: Calculate other output values.
Wt = h1-h2; % Turbine work
Wp = v3*(p1-p2)*100;  % Pump Work
h4 = Wp+h3;
W_net = Wt-Wp;  % Net Work unit in kj/kg
Qs = h1-h4;     %heat suppied
N_per = (W_net/Qs)*100;   %Efficiency
steam_rate = 3600/(Wt - Wp);   %Steam rate per second

%step 7: state point 5 and 6 which help in plotting
T5=xSteam('Tsat_p',p1);
T6=T5;
s5=XSteam('sL_p',p1);
s6=XSteam('sV_p',p1);
h5=xSteam('hL_p',p1);
h6=xSteam('hV_p',p1);
%step 8: print all state point values to show.

fprintf("\n RESULT \n')

fprintf(‘'At State point 1:\nP1 is : %4.2f Bar\nT1 is : %4.2f Degree Celcius\nH1 is : %4.2f kJ/kg\nS1 is :%4.2f kJ/kg\n\n',p1,t1,h1,s1)
fprintf('At State point 2:\nP2 is : %4.2f Bar\nT2 is : %4.2f Degree Celcius\nH2 is : %4.2f kJ/kg\nS2 is :%4.2f kJ/kg\n\n',p2,t2,h2,s2)
fprintf(‘'At State point 3:\nP3 is : %4.2f Bar\nT3 is : %4.2f Degree Celcius\nH3 is : %4.2f kJ/kg\nS3 is :%4.2f kJ/kg\n\n',p3,t3,h3,s3)
fprintf('At State point 4:\nP4 is : %4.2f Bar\nT4 is : %4.2f Degree Celcius\nH4 i %4.2f kI/kg\ns4 is :%4.2f kJ/kg\n\n',p4,t4,h4,s4)
fprintf(‘Wt is :%4.2f ki/kg\nWp is : %4.2f ki/kg\nWnet is : %4.2f kJ/kg\nNtherm is : %4.2f percent\nS.s.c is : %4.2f kg/kwh',wt,wp,w_net,N_per,steam_rate)


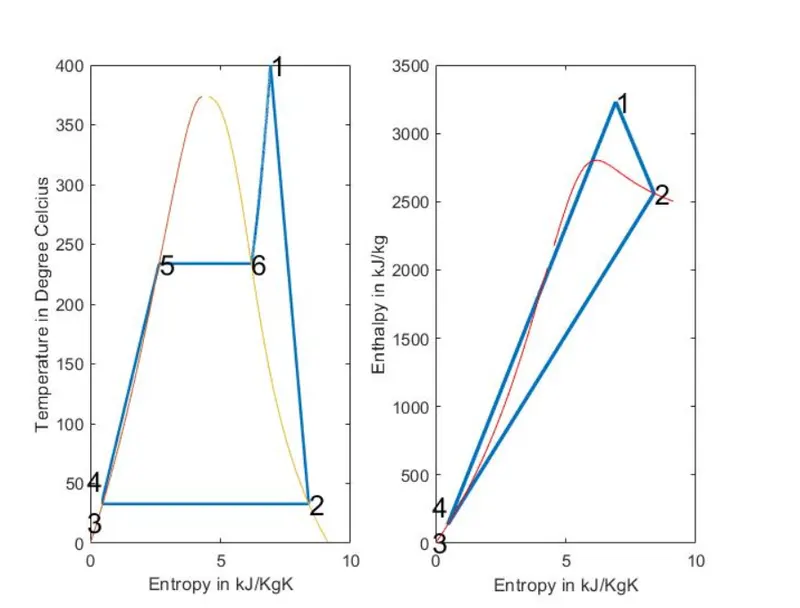
%step 9:plot T-S Diagram
subplot(1,2,1)
T_rankine = linspace(T5,11,500) ;
for i = 1:length(T_rankine)
s_rankine(i) = XSteam('s_pT',p1,T_rankine(i));
end
plot([s1 s2 s3 s4 s5 sé s_rankine],[T1 12 T3 T4 TS Te T_rankine], ‘linewidth’ 1.5);
hold on
T_curve = Linspace(1,400,500);
for i=1:length(T_curve)
s_1(i) = xSteam('sl_T',T_curve(i));
s_v(i) = xSteam('sV_T',T_curve(i));
h_1(i) = xSteam('hL_T',T_curve(i));
h_v(i) = xSteam('hv_T',T_curve(i));

end
plot(s_1,T_curve);
plot(s_v,T_curve);
text(s1,T1,'1', 'FontSize',15)
text(s2,72,'2', 'FontSize',15)
text (s3,13,'3', 'Fontsize',15, Horizontalalignment' , 'right', 'verticalAlignment' ,' top')
text (s4,14,'4', 'Fontsize',15, 'Horizontalalignment' , 'right', 'verticalalignment' , 'bottom' )
text(s5,75,'5', 'FontSize',15)
text(s6,T6,'6', 'FontSize',15)
xlabel('Entropy in k3/Kgk');
ylabel('Temperature in Degree Celcius');

%step 10:plot H-S diagram
subplot (1,2,2)
plot([s1 s2 s3 s4 s1],[h1 h2 h3 h4 h1], 'linewidth' ,2)
hold on
plot(s_v,h_v, 'color','r')
plot(s_1,h_l, 'color', 'r')
text(s1,h1,'1', 'FontSize',15)
text(s2,h2,'2', 'FontSize',15)
text(s3,h3,'3', 'FontSize' ,15, 'HorizontalAlignment', 'right', 'verticalAlignment' , 'top')
text(s4,h4,'4', 'FontSize',15, 'Horizontalalignment', 'right', 'verticalAlignment' , 'bottom')
xlabel('Entropy in k3/Kgk')
ylabel('enthalpy in kJ/kg')
graph attached,
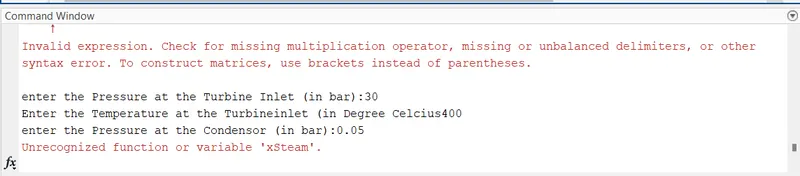
errors faced,
xsteam file before saving i ran the code which rectified and some typo error are faced,