Project 2 - Rankine cycle Simulator
- Rankine Cycle
>>Main Code
close all
clear all
clc

%Data Given
p1=30;
T1=400;
p2=0.05;

%state 1
h1=XSteam('h_pT',p1,T1);
s1=XSteam('s_pT',p1,T1);

%state 2
s2=s1;
T2=XSteam('Tsat_p',p2);
sf2=XSteam('sL_p',p2);
sg2=XSteam('sV_p',p2);
hf2=XSteam('hL_p',p2);
hg2=XSteam('hV_p',p2);
x2=((s2-sf2)/(sg2-sf2));
h2=hf2+(x2*(hg2-hf2));

%state 3
p3=p2;
T3=T2;
s3=XSteam('sL_p',p3);
h3=XSteam('hL_p',p3);

%state 4
p4=p1;
s4=s3;
cp4=XSteam('Cp_ps',p4,s4);
cv4=XSteam('Cv_ps',p4,s4);

Gamma=cp4/cv4;
T4=T3*(p4/p3)^((Gamma-1)/Gamma);
v3=XSteam('vL_p',p3);
%work utilised by pump(wp)
wp=v3*(p4-p3)*100;
h4=h3+wp;

%IN state 4-1 it possess both liquid as well as gas state
%From point 4-6 liquid phase
%state5
p5=p4;
T5=XSteam('Tsat_p',p5);
h5=XSteam('hL_p',p5);
s5=XSteam('sL_p',p5);

%From point 5-6 Dual phase
%From point 6-1 gas phase
%state6
p6=p5;
T6=T5;
h6=XSteam('hV_p',p6);
s6=XSteam('sV_p',p6);

%curve graph
T=linspace(0,400,1000);

%value for entropy at liquid(sf) & at gas(sg) state
%enthalpy at liquid(hf) & at gas(hg) state
for i=1:length(T)
    sf(i)=XSteam('sL_T',T(i));
    sg(i)=XSteam('sV_T',T(i));
    hf(i)=XSteam('hL_T',T(i));
    hg(i)=XSteam('hV_T',T(i));
end

% work done by turbine(wt)
wt=h1-h2;
%Net work output from process(wnet)
wnet=wt-wp;
%Heat addition in boiler(qin)
qin=h1-h4;
%Heat rejection in condenser(qout)
qout=h2-h3;
%Back Work Ratio
bwr=wp/wt;
%Thermal Efficiency for Rankine Cycle(ntherm)
ntherm=wnet/qin;
%specific heat consumption(ssc)
ssc=3600/(h1-h2);

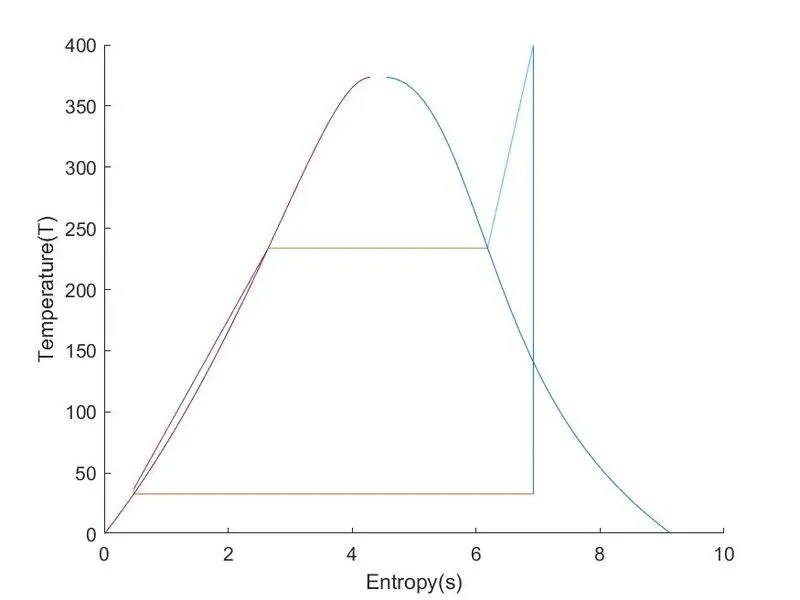
%plot the graph of Temperature vs Entropy
figure(1)
hold on
plot([s1,s2],[T1,T2])
plot([s2,s3],[T2,T3])
plot([s3,s4],[T3,T4])
plot([s4,s5],[T4,T5])
plot([s5,s6],[T5,T6])
plot([s6,s1],[T6,T1])
plot(sf,T)
plot(sg,T)
xlabel('Entropy(s)');
ylabel('Temperature(T)');
saveas(1,'T vs S.jpg')

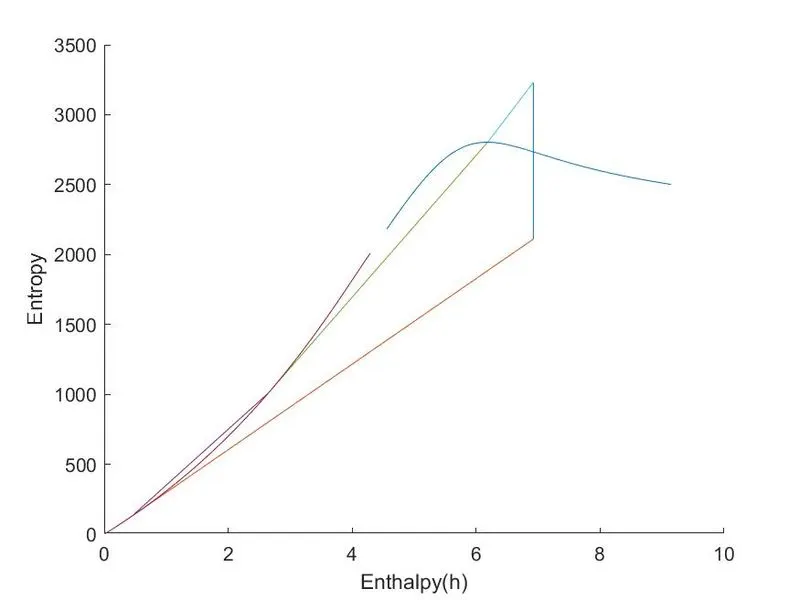
%plot for Entropy vs Enthalpy
figure(2)
hold on
plot([s1,s2],[h1,h2])
plot([s2,s3],[h2,h3])
plot([s3,s4],[h3,h4])
plot([s4,s5],[h4,h5])
plot([s5,s6],[h5,h6])
plot([s6,s1],[h6,h1])
plot(sf,hf)
plot(sg,hg)
xlabel('Enthalpy(h)');
ylabel('Entropy');
saveas(2,'H vs S.jpg')

%Detail structure for rankine cycle with output values
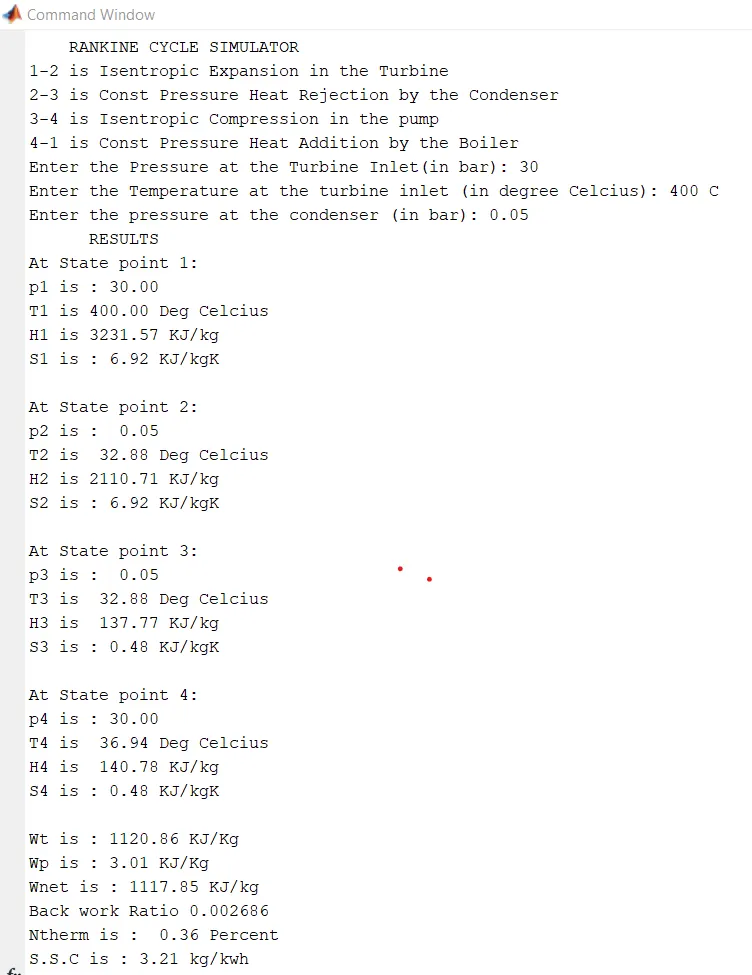
fprintf('    RANKINE CYCLE SIMULATOR\n')
fprintf('1-2 is Isentropic Expansion in the Turbine\n')
fprintf('2-3 is Const Pressure Heat Rejection by the Condenser\n')
fprintf('3-4 is Isentropic Compression in the pump\n')
fprintf('4-1 is Const Pressure Heat Addition by the Boiler\n')

fprintf('Enter the Pressure at the Turbine Inlet(in bar): %d\n',p1 )
fprintf('Enter the Temperature at the turbine inlet (in degree Celcius): %d C \n',T1)
fprintf('Enter the pressure at the condenser (in bar): %4.2f\n',p2)

fprintf('      RESULTS\n')

fprintf('At State point 1:\n')
fprintf('p1 is : %5.2f\n',p1)
fprintf('T1 is %6.2f Deg Celcius\n',T1)
fprintf('H1 is %7.2f KJ/kg\n',h1)
fprintf('S1 is : %4.2f KJ/kgK\n\n',s1)

fprintf('At State point 2:\n')
fprintf('p2 is : %5.2f\n',p2)
fprintf('T2 is %6.2f Deg Celcius\n',T2)
fprintf('H2 is %7.2f KJ/kg\n',h2)
fprintf('S2 is : %4.2f KJ/kgK\n\n',s2)

fprintf('At State point 3:\n')
fprintf('p3 is : %5.2f\n',p3)
fprintf('T3 is %6.2f Deg Celcius\n',T3)
fprintf('H3 is %7.2f KJ/kg\n',h3)
fprintf('S3 is : %4.2f KJ/kgK\n\n',s3)

fprintf('At State point 4:\n')
fprintf('p4 is : %5.2f\n',p4)
fprintf('T4 is %6.2f Deg Celcius\n',T4)
fprintf('H4 is %7.2f KJ/kg\n',h4)
fprintf('S4 is : %4.2f KJ/kgK\n\n',s4)

fprintf('Wt is : %6.2f KJ/Kg\n',wt)
fprintf('Wp is : %4.2f KJ/Kg\n',wp)
fprintf('Wnet is : %6.2f KJ/kg\n',wnet)
fprintf('Back work Ratio %f \n',bwr)
fprintf('Ntherm is : %5.2f Percent\n',ntherm)
fprintf('S.S.C is : %4.2f kg/kwh\n',ssc)
>>Command Window Output
>>Explanation:-
What is Rankine Cycle:-
The Rankine cycle is an idealized thermodynamic cycle describing the process by which certain heat engines, such as steam turbines or reciprocating steam engines, allow mechanical work to be extracted from a fluid as it moves between a heat source and heat sink.
In this program total of 6 states are used to define the Rankine cycle.
In-state between 4-1(boiler state)
> Initially it was in a liquid phase(4-5)
>Then it stated to convert in the gas state but still it has liquid drops in it. (5-6)
>It finally converted into the Gas state(6-1)
Here we have found the values for pump work, turbine work, Total heat addition, heat rejection, Network, Thermal efficiency, Back work ratio, Specific heat consumption: It is the amount of steam required to produce unit work.
Plot the graph for Temperature vs Entropy and Enthalpy vs Entropy.
The graph also has a curved graph, which defined the liquid, liquid+gas, gas stage.
Plot for T vs S
Plot H vs S: